Breast Density Changes Over Time Linked to Cancer Risk
 A study by researchers at Washington University School of Medicine in St. Louis indicates that previous mammograms hold underutilized data that could help identify women at high risk of breast cancer and even reveal which breast is likely to be affected.
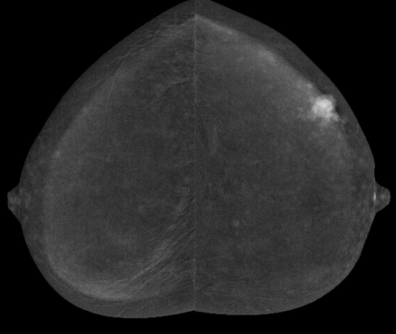
When doctors read mammograms, they assess breast density along with signs of cancer, comparing a woman’s previous mammograms to her most recent one to look for worrisome changes. But some changes are difficult to detect by eye.
In the study, researchers used a mathematical model to monitor changes in breast density over the course of a decade in almost 1,000 women and found that the rate of change differed significantly between the nearly 300 women who were later diagnosed with cancer and those who were not. The findings, available online in JAMA Oncology, could help refine current risk algorithms and aid efforts to identify women who could benefit from additional screening.
“Our best tool against breast cancer is early detection,” said senior author Graham A Colditz, MD, DrPH, associate director of Siteman Cancer Center at Barnes-Jewish Hospital and Washington University School of Medicine. “By adding the change in density over repeated images to models for risk classification in each breast, we set the stage for a better risk estimation with each updated mammogram. We can then better classify future risk and refer women to appropriate prevention strategies such as enhanced screening as part of routine breast health services.”
Doctors estimate a woman’s risk of breast cancer using factors including age, family history, presence of high-risk genetic variants and breast density. Women considered to be at high risk are referred for supplemental screening, which typically means annual magnetic resonance imaging (MRI) scans in addition to annual mammograms.
Nobody really knows why women with denser breasts are more likely to develop breast cancer. First author Shu Jiang, PhD — an associate professor of surgery in the Division of Public Health Sciences within the Department of Surgery, and a research member at Siteman — saw in repeated mammograms an untapped source of data on breast density and how it changes over time in individual breasts that might shed light on the relationship between density and disease.
She analyzed data on women in the Joanne Knight Breast Health Cohort at Siteman Cancer Center. The cohort was established by Colditz, the Niess-Gain Professor of Surgery and director of the Division of Public Health Sciences, and colleagues in 2008 to study risk factors and improve models for breast cancer risk prediction. It comprises a diverse group of more than 10,000 women who were free from cancer when they joined.
Jiang identified 289 women in the cohort who had developed cancer and compared them to 658 similar women in the cohort who did not. Each woman had received regular mammograms, so Jiang was able to collect and analyze a total of 8,710 single-breast images, representing an average of four time points over a 10-year period for each woman.
Since breast cancer rarely develops in both breasts at the same time, Jiang analyzed the images of each breast separately. Women’s breasts normally become less dense as they age, but Jiang discovered that density declined significantly more slowly in the breasts that later developed cancer than in those that did not.
“In the future, I think we can use a woman’s past history of density, plus her current density estimate, to better understand her risk level,” Jiang said. “We may even be able to determine which breast will be affected, because the density signal is strongest in the breast that goes on to develop cancer. Many women already get regular mammograms, so the data on density in each breast is already being collected. We just need to use the data more effectively.”
Colditz, Jiang and colleagues are now working on translating the findings into a form that can be used to enhance patient care. They are developing prediction models that incorporate change in breast density over time, and plan to validate the models in independent data sets.