Review ArticlePediatric Cancer
Measured Distribution of Total Red Bone Marrow in Young Children
Images
Abstract
Background and Purpose: Pediatric radiation therapy survivors incur risk for radiation-induced hematological malignancies related to red bone marrow (RBM) dose. No measurement-based analysis has been performed to characterize RBM in children. As an exploratory pilot study, we aimed to measure RBM content in children’s subvolumes through total-body MRI.
Materials and Methods: Ten pediatric total-body MRI sets were collected retrospectively, and anatomical subvolumes of RBM were delineated. The volumes of RBM in each subvolume and percentages of them in each bone region (%RBMs) were calculated as figures of merit. The %RBMs were compared to matched-age %RBM from a widely accepted mathematical model.
Results: Compared to our measured data, the model underestimated the %RBM in the cranium and mandible, as well as sternum and clavicles, and overestimated the %RBM in the upper extremities, ribs, and pelvis and vertebrae. Trends and rates of change in %RBM were consistent between our measurements and the model for these sites. We observed a gradual shift of %RBM toward the central skeleton with age.
Conclusions: The %RBM values measured in our study differed from those of the most accepted model for young children. This finding suggests that further study is warranted with a larger sample set that is more uniformly distributed in age and sex to assess the impact on clinical or research studies of the risk of subsequent hematological malignancies for survivors of childhood radiation therapy.
Excess-radiation-induced hematological malignancies (eg, acute myeloid leukemia) have been observed in survivors of pediatric radiation therapy.1-5 The risks of developing these malignancies are related to the absorbed dose deposited in the active red bone marrow (RBM).6,7 The associated projected lifetime risks of children who receive radiation therapy may be roughly estimated based on dose-effect models and the RBM dose.8 Because treatment-related radiation exposures are usually highly nonuniform throughout the body, it is important to know the accurate distribution of RBM within children’s bodies to estimate RBM doses. In the pediatric population, physiologic conversion with age of RBM into yellow bone marrow (YBM) throughout the skeleton and along individual bones alters the RBM distribution and, consequently, the amount of RBM exposed to radiation.9,10 Accurate estimation of the percentage RBM (%RBM) irradiated depends on how well the patients’ actual RBM is delineated, such as by using manual or semi-automatic tissue contouring derived from computed tomography (CT) images and then extracting the mean absorbed dose in those volumes.8
Because of its enhanced contrast in soft tissues, MRI is a sensitive imaging modality for distinguishing RBM from YBM.11 In general, RBM is composed of approximately 40% fat, 40% water and 20% protein, and YBM is composed of approximately 80% fat, 15% water and 5% protein. T1-weighted MRI image contrast is mostly influenced by the fat composition of the tissue.12 For these reasons, unlike CT imaging that poorly differentiates soft tissues, T1-weighted MRI is a useful technique for detecting differences in bone marrow changes. In T1-weighted MRI, RBM appears as much less intense than YBM.11
Previous studies have implemented different techniques to estimate the whole-body distributions of RBM and YBM for humans of various ages. Quantitative distribution of marrow space in adults was reported by Mechanik et al.13 In this report from 1926, the authors studied the weight of bone hematopoietic tissue plus fat in 13 carefully handled and dissected cadavers. Later, in 1961, Ellis14 applied the correction factor of Custer and Ahlfeldt15 to these data, which considered cellularity factor, and reported for each bone region the %RBM in adults. Also, in the 1960s, Atkinson16 established an assumption-based model to estimate the bone marrow distribution in children. These findings, however, did not correlate to those of Hudson17 who reported anatomical data for late-fetus and newborn infants. In what has become the gold standard for bone marrow distribution in humans, in the 1980s Cristy18 developed a mathematical model that incorporated many of the previously mentioned anatomical and mathematical studies. Specifically, Cristy applied a mathematical interpolation of data from previous studies to estimate %RBM in different body regions among all age categories, including the pediatric age group. However, to our knowledge, only mathematical models have been used to estimate whole-body distributions of RBM for young children and adolescents, and no measurement-based study has been performed to date.
MRI-based studies9,19 reported the changes in bone marrow volumes in portions of the body with respect to age. Ricci et al reported the pattern of change of bone marrow along the axial skeleton based on 420 site-specific examinations of the skull, cervical spine, thoracic spine, lumbar spine, pelvis and proximal femora of different patients of different age groups (6 months to 70 years). Patterns of changes in cellularity and bone marrow density with age at each site were reported, independent of sex.9 A separate study by Simonson and Kao reported developmental patterns of bone marrow in the skull alone, using 324 examinations, with main findings showing the correlation between age and marrow intensity and patterns of marrow conversion in the skull and facial bones. They found no difference between sexes.19 Neither study reported %RBM of each site with respect to the total-body RBM, as they lacked total-body imaging. On this basis, the literature lacked a measurement-based study that accurately characterized the distribution of RBM throughout the entire bodies of young children and adolescents.
The purpose of this study was to measure the distribution of RBM in bones of the pediatric age group based on T1-weighted total-body MRI (TB-MRI). Specifically, for an exploratory pilot set of 10 patients who had undergone TB-MRI in our institution, we delineated their entire skeletal RBM and calculated the %RBM in various regions of their bodies. We compared these measurement-based %RBM results for various-aged children with those of Cristy’s model. The motivation for this study to improve our understanding of RBM distributions for children of various ages was greater certainty in absorbed dose in the RBM during childhood radiation therapy or other radiation exposures.
Methods and Materials
This study was performed under an approved protocol by our center’s institutional review board. We set out to retrospectively collect all TB-MRI sets in our clinical database with the following selection criteria:
- Nine males and nine females of ages uniformly distributed from 1 month to 18 years at the time of MRI
- MRI dated January 1, 2005, to July 14, 2015
- Uniform distribution of ages of male or female
- Availability of high-resolution TB-MRI sets.
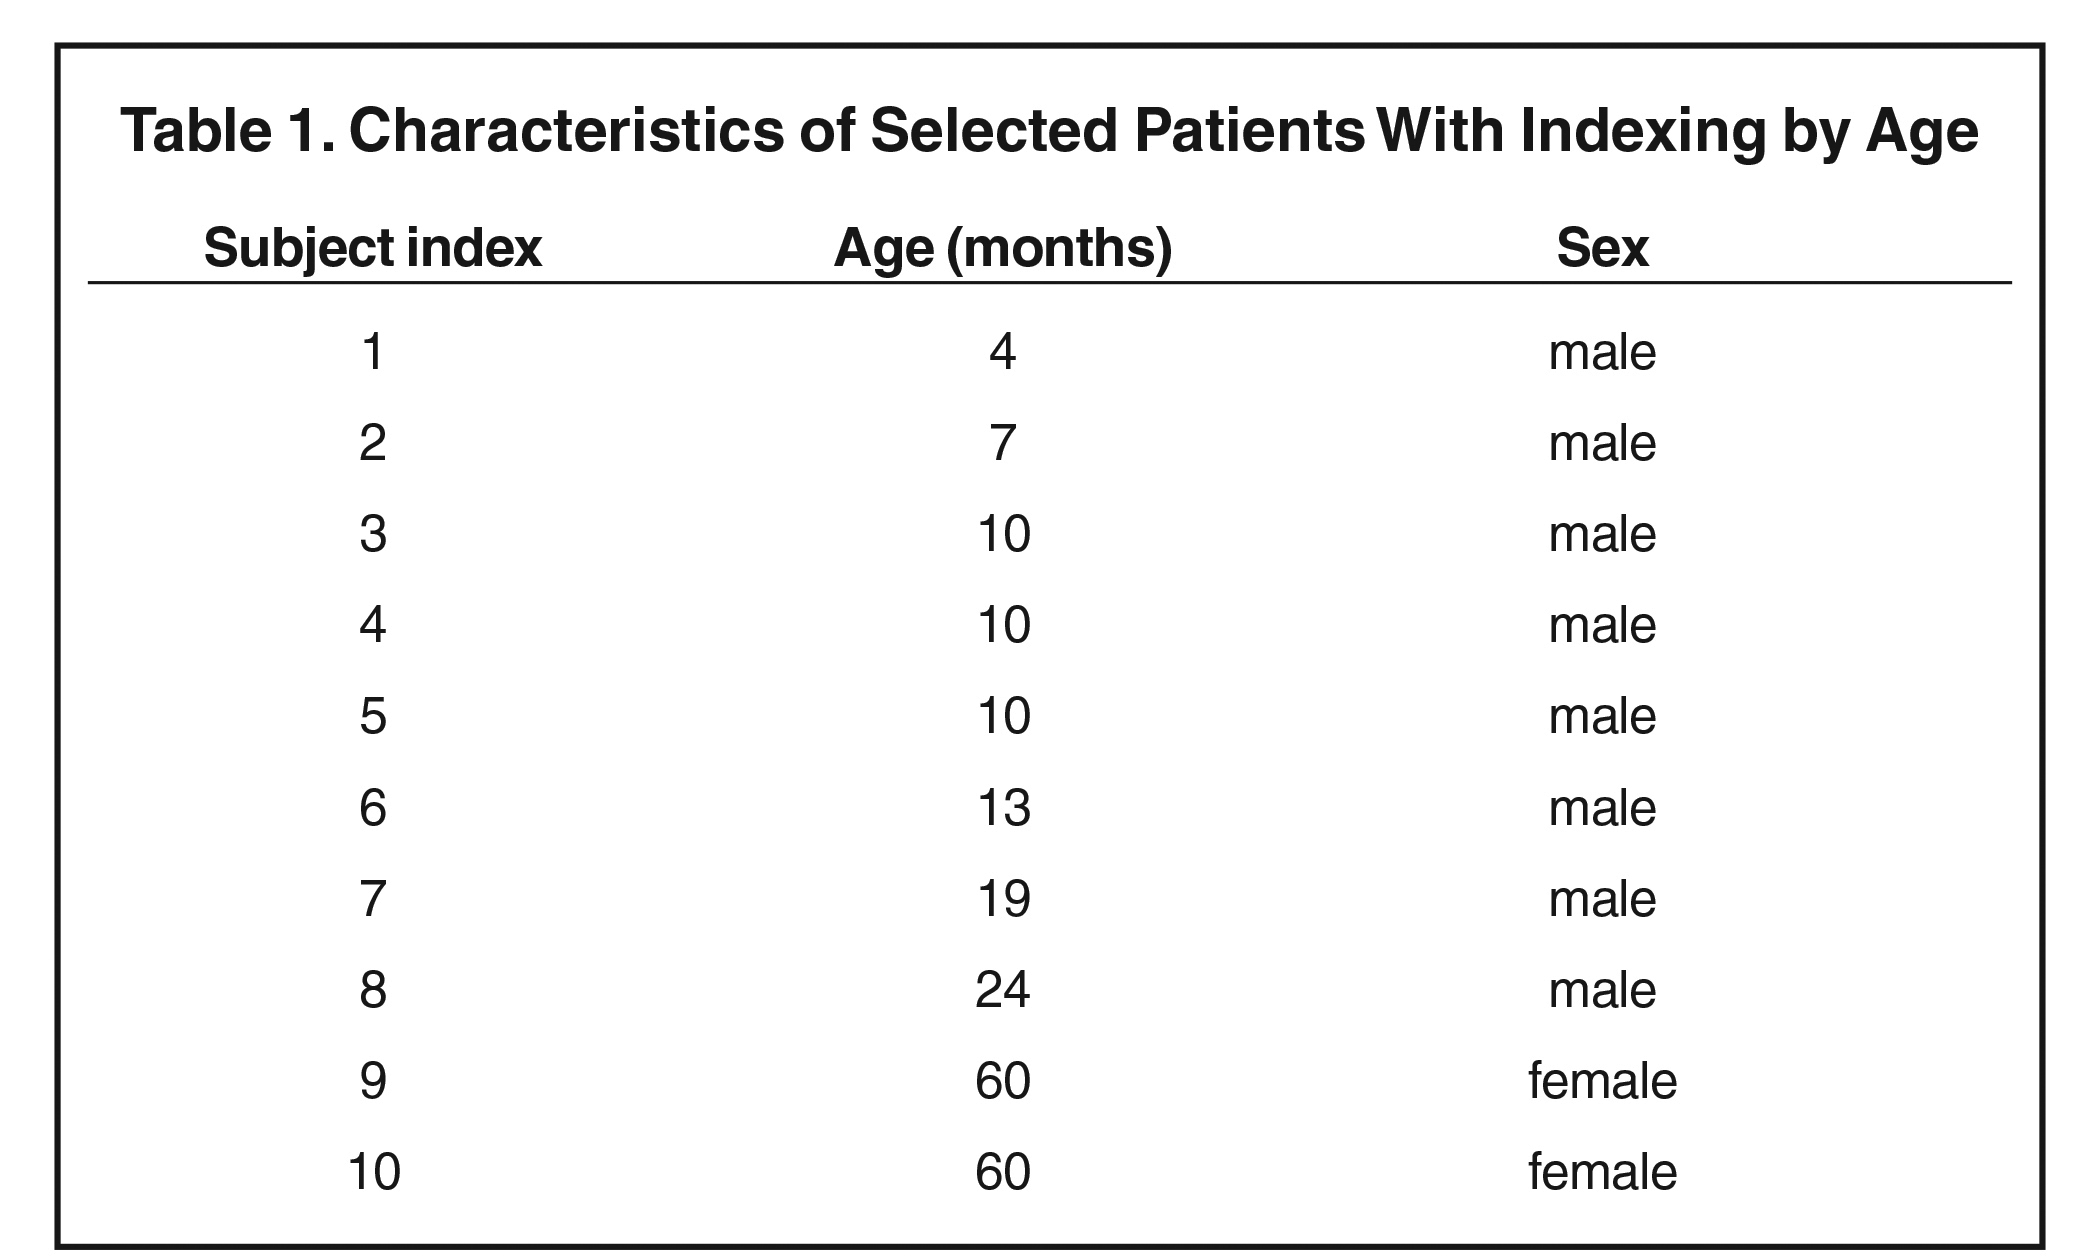
These initial targeted sample size and characteristics were chosen to obtain a set of subjects that spanned the full ranges of age and sex of young children and adolescents. Patients diagnosed with a disease affecting marrow content—including hematological malignancies, anemia, chronic infectious diseases, hemoglobinopathy, red marrow hyperplasia, obesity-related respiratory disorders, diabetes, or benign tumors with bone or marrow involvement—were excluded from the study. In addition, subjects were excluded if they were known to have received any form of bone-marrow-affecting treatment (such as chemotherapy, immunotherapy, steroids, hematopoietic growth factors, or radiation therapy) within 6 months prior to TB-MRI. Patients with multiple, repetitive follow-up MRI were considered as separate subjects if they satisfied the inclusion and exclusion criteria. The result of data collection was 10 patients, listed in Table 1 (see section 3). A senior pediatric hematologist and oncologist reviewed all the patients’ charts and verified those who met the inclusion and exclusion criteria. Finally, a senior board-certified pediatric radiologist reviewed the quality of the subjects’ TB-MRI sets, and those of poor quality or lacking a full-body reconstructed imaging sequence were removed from the study.
We considered the coronal T1-weighted sequence as the most consistently obtained in our pediatric population. Subsequently, all coronal T1-weighted sequences of the study population were extracted from our clinical picture archiving and communication system (Impax, version 6.5 AGFA HealthCare) and saved as image objects in the Digital Imaging and Communications in Medicine (DICOM) format. The image sets were de-identified and electronically transferred to our clinically commissioned treatment planning system (TPS) (Panther, version 5.10, Prowess, Inc.) as primary images of new patients.
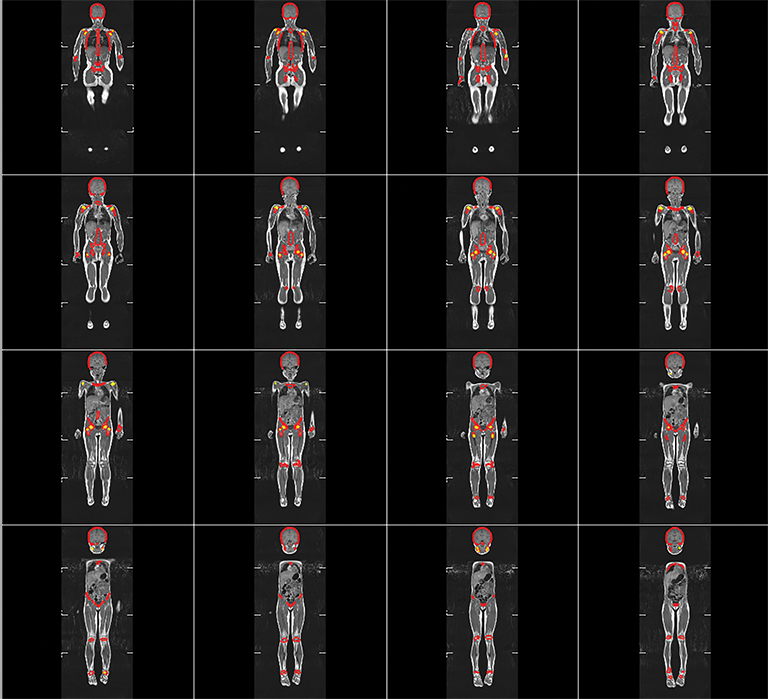
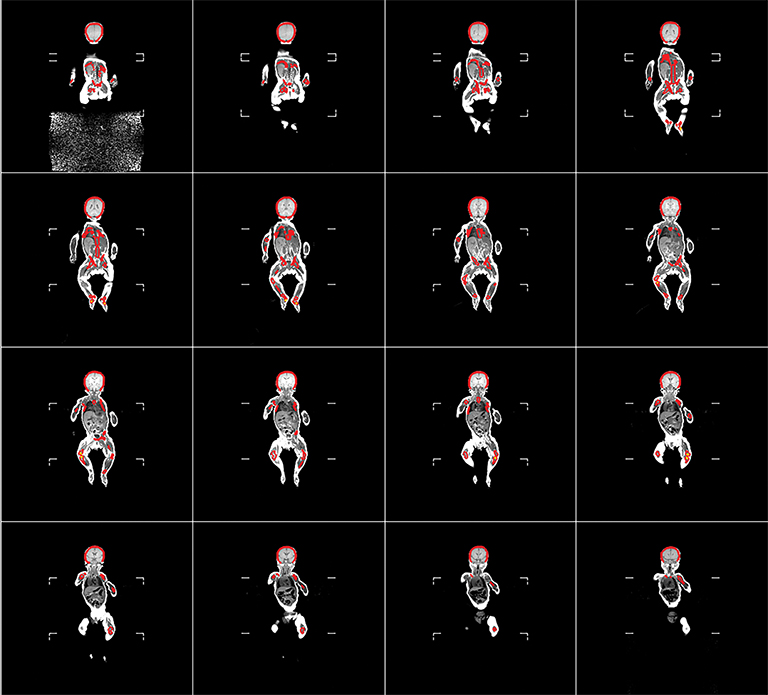
The RBM and YBM contouring was performed in the following manner for each patient: First, all RBM was identified and contours were drawn manually on each slice of the reconstructed MRI set. Second, the YBM found within these RBM contours was identified by fat-tissue-like high-signal intensity and then contoured on each slice. Third, to define the pure RBM volumes, a Boolean subtraction was performed automatically between the RBM and partial YBM volumes (Figure 1). Areas of intermediate-intensity bone marrow, which are functionally a mixture of RBM and YBM, were considered RBM because they produce blood cell products. Fourth, anatomical landmarks were used to segment between different body regions and create regional subvolumes of RBM. For the volumetric data, we categorized the regions as the lower extremities, pelvis, vertebrae, ribs, clavicle, sternum, scapula, upper extremities, and head and neck. For comparison with the previous mathematical model, these regions were re-categorized into head and neck, lower extremities, upper extremities, sternum and clavicle, scapula, ribs, and pelvis and vertebrae. These contours and final regional RBM were verified by the senior board-certified pediatric radiologist. Finally, volumes of regional RBM were calculated by the TPS, and %RBM in each body region was determined by dividing its volume by the volume of RBM in the whole body of each subject.
Results
After accounting for all inclusion and exclusion criteria, we identified 10 high-resolution TB-MRI sets in which bone marrow could be delineated throughout each subject’s entire body. Upon review of all cases in our clinical database, we found it lacked the inventory necessary to produce a full cohort of pediatric patients consisting of equal numbers of both sexes and uniformly distributed from 1 to 18 years of age. The set of 10 subjects was nonuniformly distributed in age from 4 months to 60 months and in sex, with eight boys and two girls having high-resolution TB-MRI (Table 1). Therefore, this final cohort was re-categorized as a young pediatric age group, not as both children and adolescents, and this became a pilot study for further exploration.
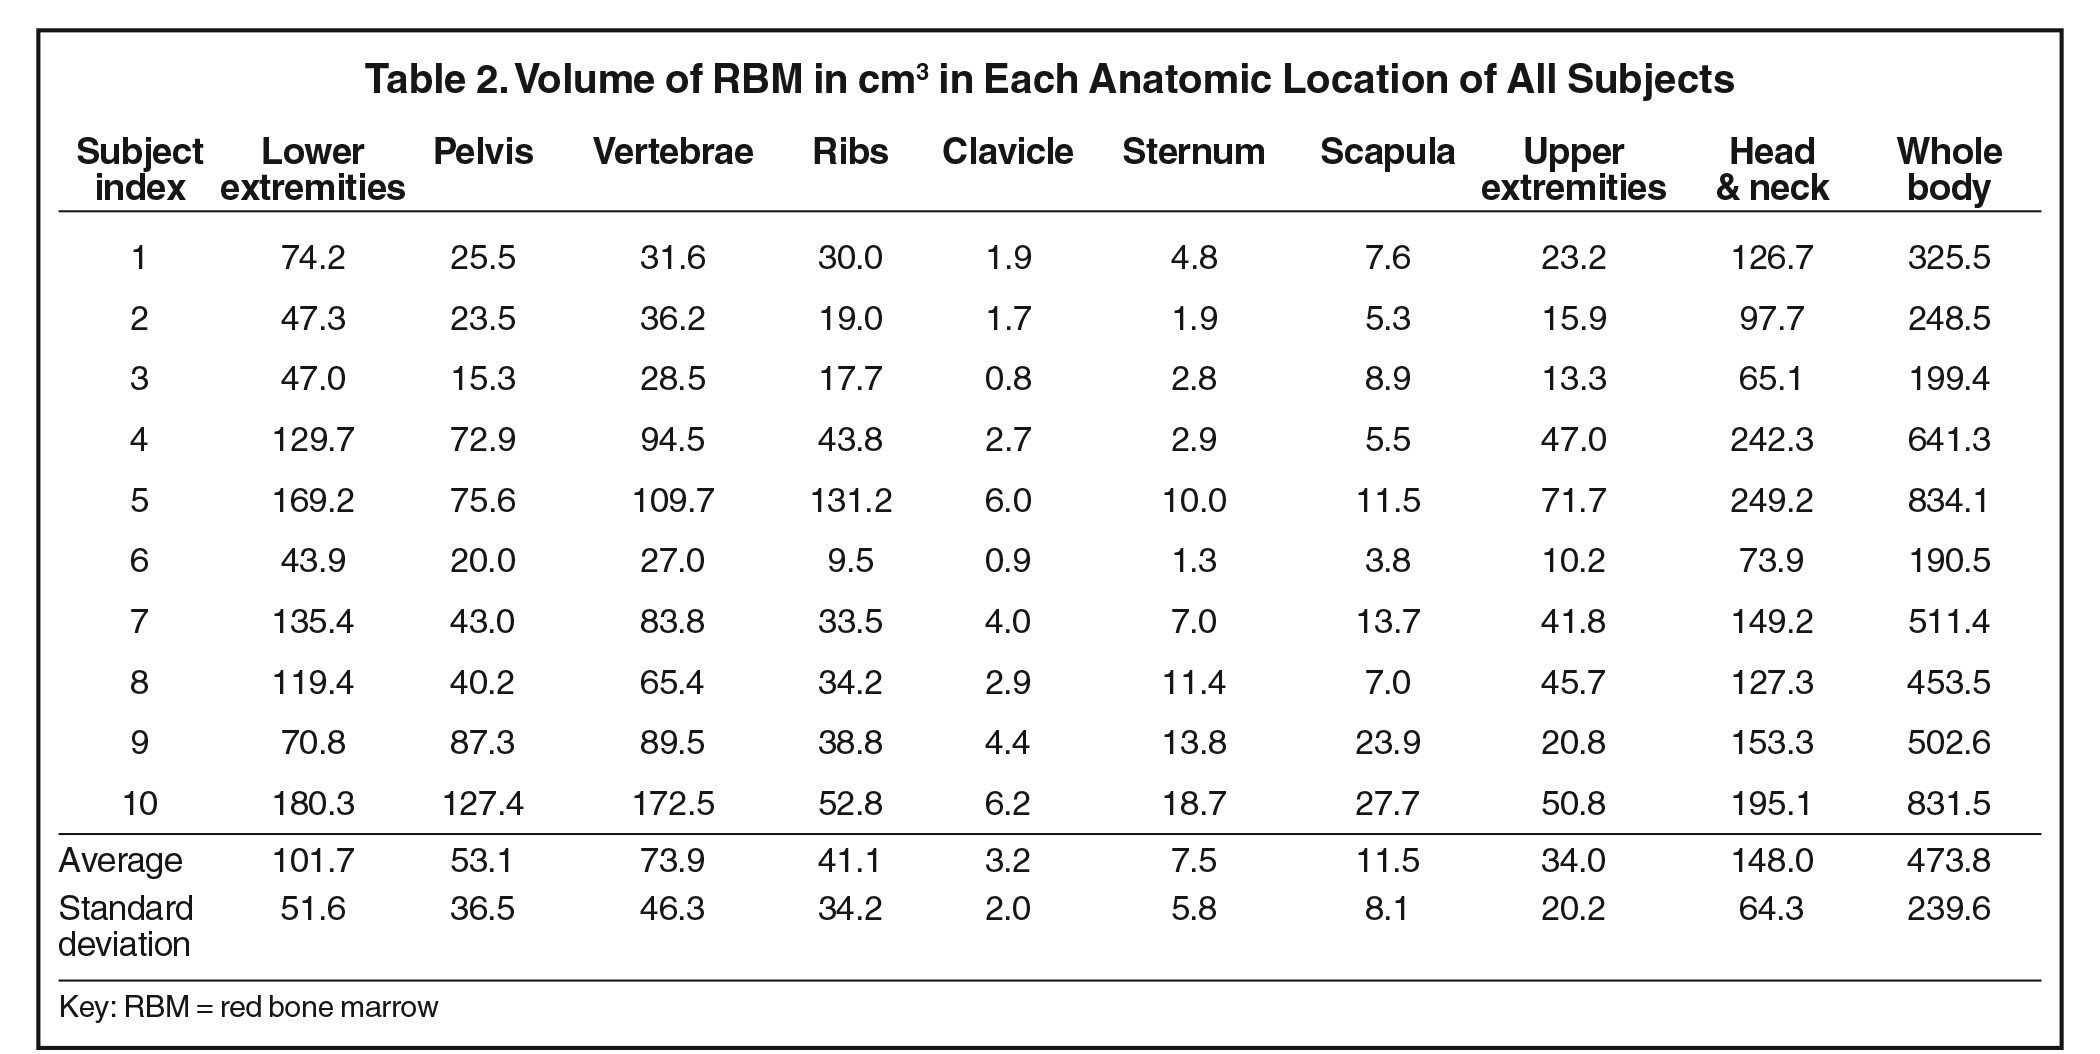
Volumes in anatomical regions for each subject are listed in Table 2. The head and neck RBM accounted for the largest amount of RBM among the designated regions. The RBM in the lower extremities roughly tripled that of the upper extremities. More RBM was found in the vertebrae than in the pelvis for every subject. We observed that active marrow gradually shifted from the periphery toward the central skeleton with increasing age in this young pediatric set of patients.
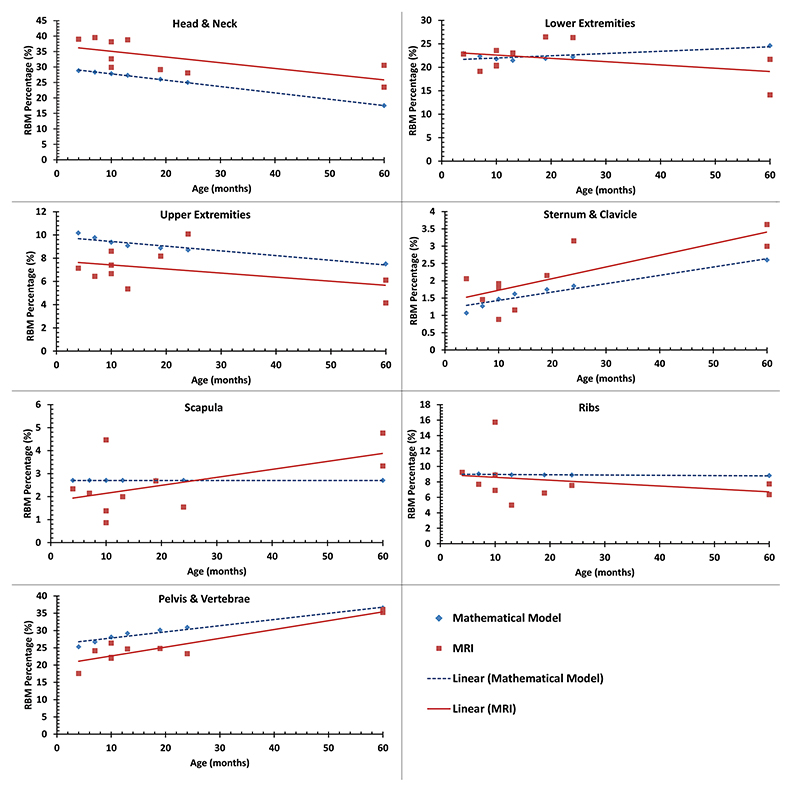
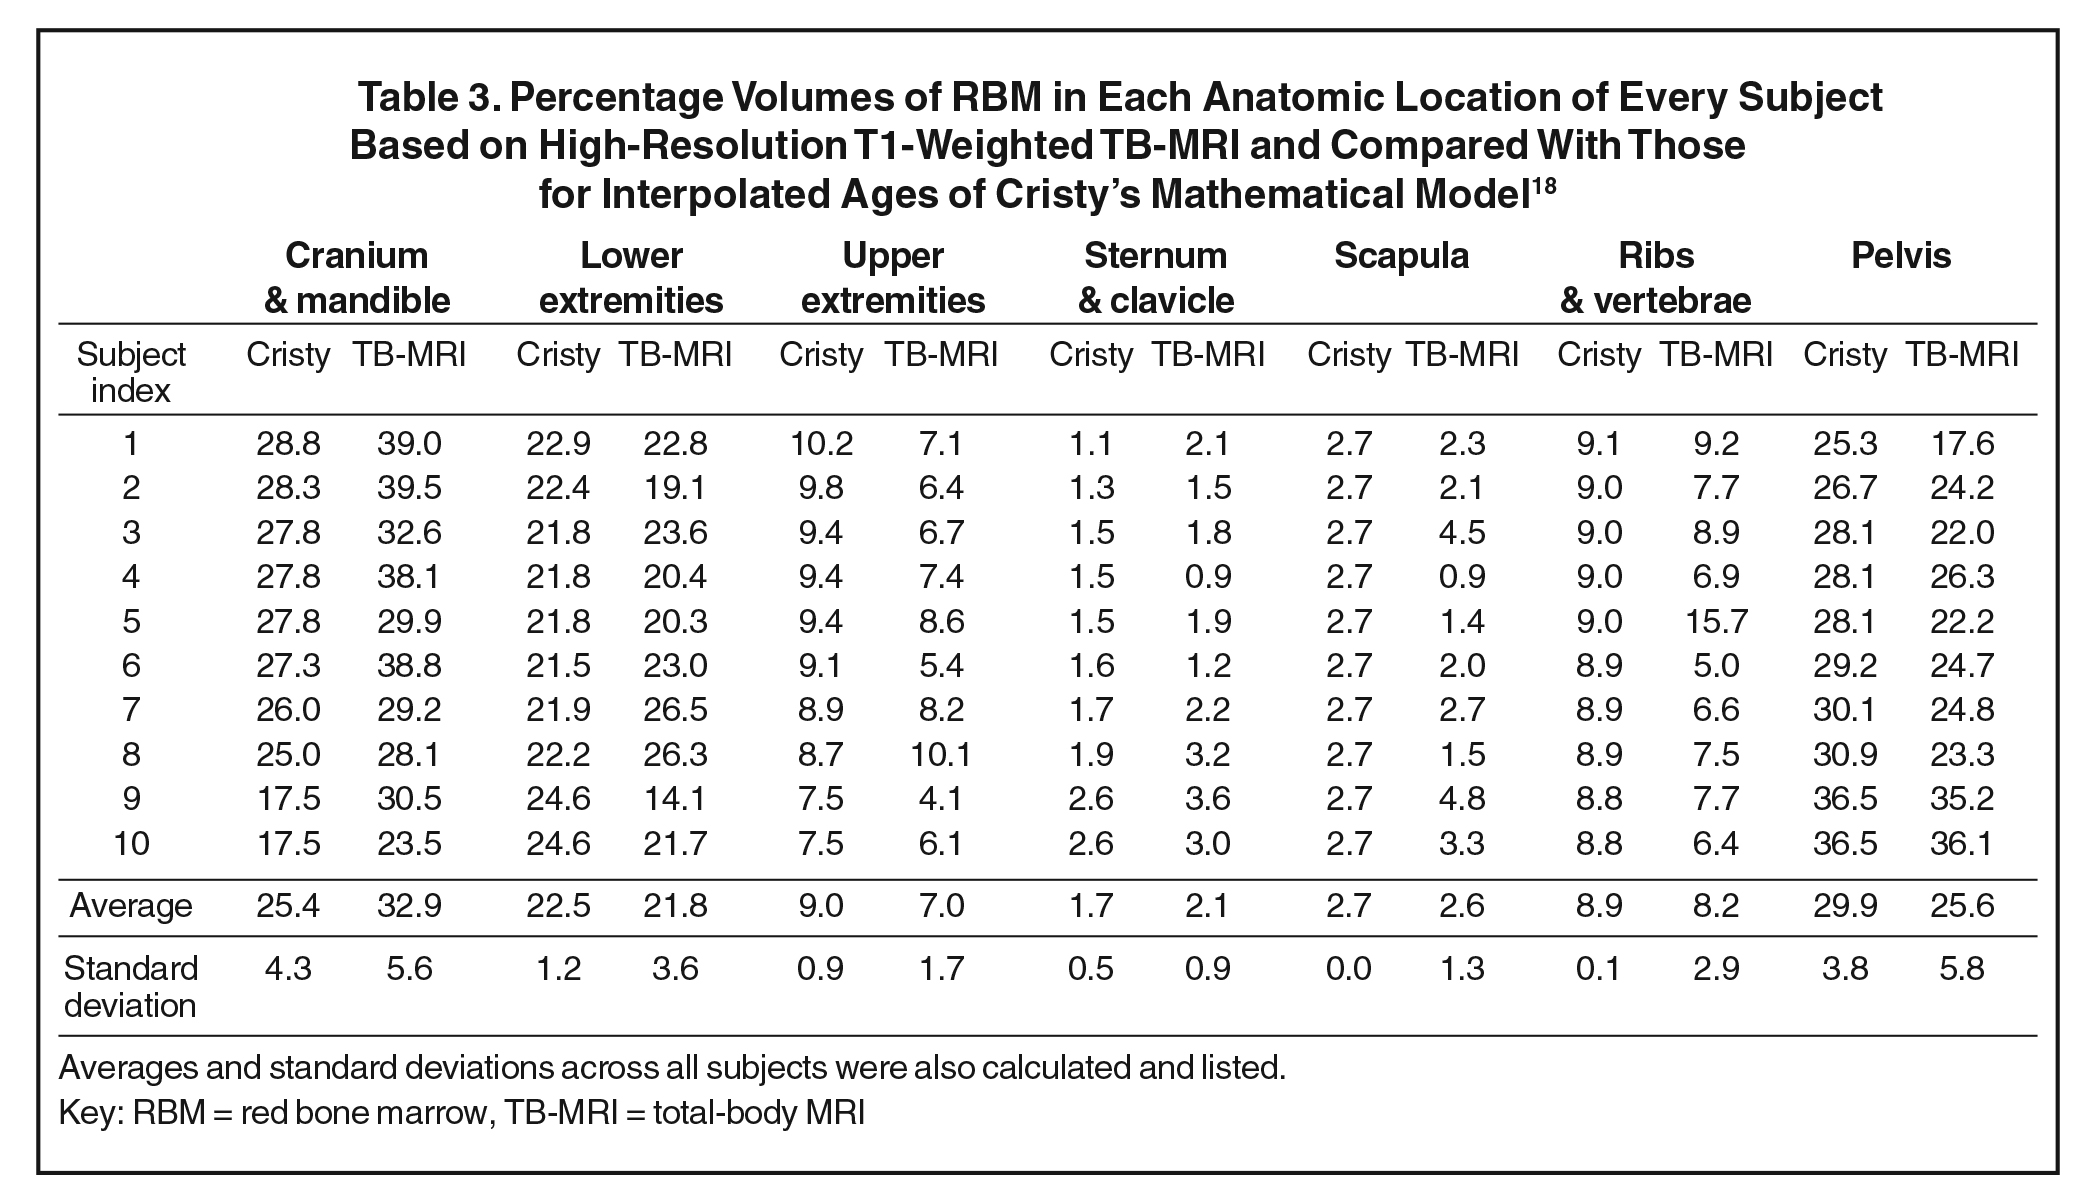
For an age-matched comparison, we interpolated linearly the mathematical-model-based %RBM values from Cristy’s study18 (Table 3) for the ages of the subjects in our MRI-based study. The mean values of %RBM average across ages of these young children were within approximately one standard deviation between the two studies, suggesting that the values of Cristy’s model were roughly on track with measured data. Both the MRI- and mathematical-model-based data are plotted in Figure 2 for each body region. Similar to the Cristy model, our measured %RBM rose with increasing age in the sternum and clavicle as well as pelvis and vertebrae regions, and fell with increasing age in the head and neck, and upper extremities regions. Our data contradicted the upward trend in the lower extremities and the flat %RBM in the scapulae vs age in the Cristy model. Our measurements were consistent with Cristy’s flat model vs age for the ribs.
Discussion
In this pilot study of 10 subjects, we used T1-weighted MRI to estimate the volumes and %RBM in various regions of the bodies of young children. We observed a gradual shift and redistribution with age of RBM from appendicular to central skeleton. This natural trend was expected and coincides with the previously reported mathematical and imaging models. We found some differences in trends between the measured MRI-based data and the mathematical-model-based data in estimating the distribution of %RBM in different body parts in young children. Finally, our limited sample set agreed with others’ previous findings that no differences exist in red bone marrow distribution between sexes.
Compared with previously published results of %RBM based on mathematical modeling, our measured data confirmed these estimations for some body regions but disagreed in other regions. In the lower extremities, ribs and scapulae, the modeled data agreed well with our measured data. However, compared with the children in our study, the mathematical model underestimated the %RBM in the head and neck, and sternum and clavicle regions and overestimated the %RBM in the upper extremities, and pelvis and vertebrae regions.
We also compared qualitatively the measured and modeled results in the relationship between %RBM and age. The %RBM values in lower extremities tended to be lower for children older than 5 years in the mathematical model, but our data suggest they may lower at a younger age. Moreover, the %RBM in the scapulae did show a trend toward increase at a later age (greater than 5 years) in the mathematical model, yet again we noted that trend in an earlier age group (less than 5 years). Therefore, our data suggest that changes in the percentages of RBM at the lower extremities and scapulae occur earlier than what has been previously estimated. Finally, our findings confirmed the %RBM at the pelvis and vertebrae in that age group compared with Cristy’s model.
This was the first study, to our knowledge, to estimate the %RBM in various body regions of children using TB-MRI. With the availability of high-resolution MRI, we were able to delineate active RBM from inactive YBM. The ability to identify bone marrow and distinguish between RBM and YBM is especially important for pediatric cancer patients, many of whom undergo MRI for evaluation of their primary tumor, radiation therapy treatment planning, or follow-up assessments of treatment response. Moreover, in the current trend toward developing MRI-based radiation therapy treatment plans, RBM quantification and delineation by TB-MRI may become more readily available in clinical settings. This could improve targeting of treatment volumes and avoidance of organs and tissues at risk for acute and late radiation therapy side effects. High-resolution TB-MRI may aid understanding of radiation-induced secondary hematological malignancies3,8 and improve training of dose-effect models of hematological toxicities and malignancies after childhood exposures.7 Finally, using TB-MRI to delineate bone marrow structures and substructures could increase precision for targeted radiation therapy—for example, in stem cell sterilization—when fused with CT simulation images. This application introduces the possibility of less severe morbidities and reduced late mortalities than total-body irradiation while maintaining disease control. These potential advanced applications of MRI-based RBM and YBM delineation are particularly relevant considering the substantial improvements in MRI speed and progress of MRI-guided radiation therapy in mainstream cancer care.21
Because of the highly specific inclusion and exclusion criteria for patient selection and the limited data in our institution, our post-IRB-approval data collection resulted in a small sample size. The small and nonuniform distribution of our sample set with age and sex was an unpredictable limitation a priori. This retrospective study demonstrated the feasibility of performing forward research protocols with larger sample sets of pediatric patients using high-resolution MRI to further characterize the %RBM in various region of the body in young children and adolescents, for example by institutions with large throughputs of pediatric patients and high-speed MRI. The findings and implications of our study warrant a larger, more representative sample set across both sexes and a broader range of ages. A second limitation and opportunity for improvement in future studies was that not all TB-MRI sets were collected under the same protocol. This resulted in inconsistent TB-MRI image quality between subjects. For this reason, we standardized our contouring on coronal views and T1 weighting, choosing consistency in protocol between patients over segregation of fine details of RBM in small bones, such as facial, ribs and small extremities. This tradeoff led to deficiencies in measuring %RBM in these bones. Finally, another study limitation was that the detailed pathology of the included list of patients was not reported, which could lead to an information bias potentially affecting the RBM distribution among this cohort. However, our initial exclusion criteria were strict in excluding all patients known to have pathologies that could affect RBM distribution.
In conclusion, our average %RBM values in young children measured using TB-MRI were consistent with those of a widely accepted mathematical model, but trends and rates of change vs age were not. We demonstrated the feasibility of high-resolution TB-MRI for measuring RBM distributions in children. Further studies are needed with larger and more uniformly distributed sample sets to establish more definitive results.
Acknowledgements
We thank Dr. Raya Saab for collecting and interpreting the patients’ clinical histories, Ms. Hana Mekdash and Dr. Bilal Shahine for transferring their MRI sets into the treatment planning system, and Mrs. Chirine Chehab for assisting with graph design.
References
- Haselow RE, Nesbit M, Dehner LP, Khan FM, McHugh R, Levitt SH. Second neoplasms following megavoltage radiation in a pediatric population. Cancer. 1978;42:1185-1191.
- Potish RA, Dehner LP, Haselow RE, Kim TH, Levitt SH, Nesbit M. The incidence of second neoplasms following megavoltage radiation for pediatric tumors. Cancer. 1985;56:1534-1537.
- Tsui K, Gajjar A, Li C, et al. Subsequent neoplasms in survivors of childhood central nervous system tumors: risk after modern multimodal therapy. Neuro Oncol. 2015;17:448-456.
- Friedman DL, Whitton J, Leisenring W, et al. Subsequent neoplasms in 5-year survivors of childhood cancer: the Childhood Cancer Survivor Study. J Natl Cancer Inst. 2010;102:1083-1095.
- Meadows AT, Friedman DL, Neglia JP, et al. Second neoplasms in survivors of childhood cancer: findings from the Childhood Cancer Survivor Study cohort. J Clin Oncol. 2009;27:2356-2362.
- Newhauser WD, Fontenot JD, Mahajan A, et al. The risk of developing a second cancer after receiving craniospinal proton irradiation. Phys Med Biol. 2009;54:2277-2291.
- National Research Council of the National Academies of Sciences. Health risks from exposure to low levels of ionizing radiation: BEIR VII phase 2: National Academies Press; 2006.
- Taddei PJ, Khater N, Zhang R, et al. Inter-institutional comparison of personalized risk assessments for second malignant neoplasms for a 13-year-old girl receiving proton versus photon craniospinal irradiation. Cancers. 2015;7:407-426.
- Ricci C, Cova M, Kang YS, et al. Normal age-related patterns of cellular and fatty bone marrow distribution in the axial skeleton: MR imaging study. Radiology. 1990;177:83-88.
- Laor T, Jaramillo D. MR imaging insights into skeletal maturation: What is normal? Radiology. 2009;250:28-38.
- Małkiewicz A, Dziedzic M. Bone marrow reconversion—imaging of physiological changes in bone marrow. Pol J Radiol. 2012;77:45-50.
- Vande Berg B, Lecouvet F, Michaux L, Ferrant A, Maldague B, Malghem J. Magnetic resonance imaging of the bone marrow in hematological malignancies. Eur Radiol. 1998;8:1335-1344.
- Mechanik N. Untersuchungen über das Gewicht des Knochenmarkes des Menschen. Anat Embryol. 1926;79:58-99.
- Ellis R. The distribution of active bone marrow in the adult. Phys Med Biol. 1961;5:255.
- Custer R, Ahlfeldt FE. Studies on the structure and function of bone marrow. J Lab Clin Med. 1932;17:951-960.
- Atkinson H. Bone marrow distribution as a factor in estimating radiation to the blood-forming organs. Australas Radiol. 1962;6:149-154.
- Hudson G. Bone‐marrow volume in the human foetus and newborn. Br J Haematol. 1965;11:446-452.
- Cristy M. Active bone marrow distribution as a function of age in humans. Phys Med Biol. 1981;26:389.
- Simonson T, Kao S. Normal childhood developmental patterns in skull bone marrow by MR imaging. Pediatr Radiol. 1992;22:556-559.
- Blebea JS, Houseni M, Torigian DA, et al. Structural and functional imaging of normal bone marrow and evaluation of its age-related changes. Semin Nucl Med. 2007;37(3):185-194.
- Chen X, Prior P, Chen GP, Schultz CJ, Li XA. Technical note: dose effects of 1.5 T transverse magnetic field on tissue interfaces in MRI‐guided radiotherapy. Med Phys. 2016;43:4797-4802.
Citation
Abu-Gheida I, Zaghal A, Naffaa L, Taddei PJ. Measured Distribution of Total Red Bone Marrow in Young Children. Appl Rad Oncol. 2021;(2):30-37.
July 27, 2021
Latest Review Articles
- A Narrative Review on Radiation Oncology Physician Well-Being in the United States
- A Novel Framework to Define and Prognosticate Visual Outcomes Following Fractionated Radiation Therapy for Optic Nerve Sheath
- A Practical Method to Prolong Expiratory Breath Holds for Abdominal Stereotactic Body Radiation Therapy
- Radiation Therapy-Induced Toxicity in a Breast Cancer Patient With Variance of Unknown Significance in the Ataxia Telangiectasia
- Late Effects of Pelvic Radiation Therapy in the Female Patient: A Comprehensive Review