Research ArticleHead & Neck cancer
High-Fidelity CT-on-Rails-Based Characterization of Delivered Dose Variation in Conformal Head and Neck Treatments
Introduction
Conformal radiation therapy is a highly effective treatment approach for many cancers. Intensity-modulated radiation therapy allows for a more precise conformation of radiation dose to the targeted tumor volume and increased sparing of surrounding normal tissues.1-3 Due to the high sensitivity of head and neck tissues and subsequent potential for nontrivial side effects, it is imperative that the high-dose region be delivered with high accuracy and consistency.4 Advanced image-guided radiation therapy (IGRT) techniques, such as cone-beam CT (CBCT) and in-room CT on rails (CTOR), increase the accuracy of dose delivery, thereby helping to ensure the fidelity of the delivered dose distribution relative to the planned distribution. However, even the best IGRT approach cannot undo anatomical changes, such as weight loss or tumor shrinkage, which occur in patients as the radiation course progresses. These changes can compromise target coverage or increase doses to sensitive structures.
Although dose deviations from planned distributions are known to occur throughout the treatment and have been previously studied,5 the accuracy of such evaluations is inherently limited by the quality of the in-room, daily imaging modality. Even when 3D imaging is obtained daily via CBCT, the reduced spatial, contrast, and Hounsfield unit (HU) resolution of CBCT, relative to the fan-beam CT (FBCT) simulation dataset, limits the precision with which dose variation can be studied. In particular, the increased scatter component of CBCT imaging influences the relationship between HU, attenuation coefficient, and electron density of patient tissues,6 resulting in increased uncertainty in dose calculations compared with FBCT images.
In previous studies7-10 on dose tracking, a limited number of patients (10-18) were included in the study cohorts, which used in-room tomotherapy megavoltage CT,7 an integrated CT-linear accelerator system,8 return of patient to the CT simulator, and kV CBCT10 to image anatomical changes during the treatment course. To address the data deficiency problem and gain a better understanding of potential dose deviation, McCulloch et al11 built a larger cohort of 100 patients. This added clinical variety and significance to the evaluation; however, the daily imaging modality was still limited to kV CBCT and full 3D dose accumulation was not available, necessitating an approximation to estimate the accumulated dose and thus introducing additional uncertainties into the evaluation.
To improve the accuracy and reliability of recalculated dose distributions, we present accumulated, full-course dose distributions for 74 patients with HNC treated at our facility using in-room, fan-beam CTOR image guidance of identical quality from which the patient was originally simulated and planned. Acquisition of CTOR kV FBCT images on a weekly to near-daily basis for these patients has enabled us to compile a large FBCT dataset for high-quality dose variation investigation. In addition to improved dose-calculation accuracy, the FBCT-to-FBCT image registration employed here facilitates more accurate structure mapping between CT of the day and simulation planning CT. In combination with an FBCT-based, high-fidelity, full-dose recalculation, this allows for improved accuracy in dose tracking and summation that has comparable accuracy to the original plan.
Moreover, such high-accuracy reconstruction of delivered dose ensures improved accuracy in the characterization of dose variations from the original plan. This improved understanding of delivered dose variation, in turn, facilitates improved insights into circumstances leading to observed side effects, along with an evolved rationale for adaptive replanning time points.
Materials and Methods
Patient Data
Our novel dataset consists of 74 patients with HNC treated between 2012 and 2020. The study was approved by the Institutional Review Board. For each patient, there is 1 planning FBCT simulation scan, 1 approved and delivered treatment plan, and 10 to 39 daily FBCT IGRT image sets, with an average of 19.0 daily FBCTs per patient. The frequency of imaging in the patient cohort ranges from 1 to 2.7 days, with more than half of the patients receiving a FBCT at least every second day during the treatment.
All patients were originally planned in the Eclipse treatment planning system (TPS) (version 11.0.42; Varian) and dose was calculated using the anisotropic analytical algorithm. Additional plan details, patient demographics, and clinical characteristics are detailed in
Demographics of Our Patient Cohort
| PATIENT COHORT | |
|---|---|
| Patients, | 74 |
| Sex, | |
| 63 (85.1%) | |
| 11 (14.9%) | |
| Age, y | |
| 59.7 | |
| 23 | |
| 79 | |
| Disease site, | |
| 49 | |
| 5 | |
| 4 | |
| 4 | |
| 4 | |
| 8 | |
| Concurrent chemotherapy, | 57 |
| Definitive radiation therapy, | 64 |
| Fractions, | |
| 49 (66.2%) | |
| 9 (12.2%) | |
| 9 (12.2%) | |
| 4 (5.4%) | |
| 3 (4.0%) | |
| Prescribed dose, cGy | |
| 8 (10.8%) | |
| 23 (31.0%) | |
| 29 (39.2%) | |
| 9 (12.2%) | |
| 4 (5.4%) | |
| 1 (1.4%) | |
Image-Guided Radiation Therapy
Patients were treated on a Siemens Artiste linear accelerator equipped with an in-room Siemens CTOR scanner (SOMATOM Sensation 40; Siemens Healthineers), which was used for pretreatment imaging and positioning.
Dose-Tracking Workflow
Dose tracking was carried out using the RayStation TPS12 (version 10A; RaySearch Laboratories AB) and automated using the built-in scripting application programming interface. Original planned dose distributions were recalculated in RayStation prior to starting dose accumulation. Several scripts were developed to automate the following steps: replicate the registration utilized for image guidance, deformable image registration (DIR), contour propagation, dose calculation on daily images, dose deformation, and dose accumulation.
Rigid registrations utilized for daily image guidance are stored in digital imaging and communications in medicine files as a frame-of-reference transformation matrix and include the operations of translation and rotation. Registrations were loaded into RayStation, along with daily images, then applied to reproduce daily setup and map beams to CTs of the day for daily dose calculation.
Deformable image registration was carried out using a hybrid deformable registration technique (ANACONDA)13 in RayStation, which combines image intensity and anatomical information (including regions of interest and points of interest together). In our implementation, the anatomical information was not used in the registration technique and the objective function consisted only of image similarity and grid regularization terms.
After calculating the deformation map, the organs at risk (OAR) and target contours were propagated to the daily CT space using the deformation field. Dose was then calculated using the RayStation collapsed cone algorithm14 on each daily CT image to estimate the actual delivered dose distribution for each treatment session. Subsequently, daily doses were deformed back to the planning CT and accumulated to allow for direct comparison against the planned dose distribution. For treatment days without daily CT images, the most recent prior dose calculation was repeated in the accumulation.
To circumvent potential errors in dose evaluation related to variations of field of view (FOV) in daily images, a sequence of contours that delineated the FOVs in both the planning CT and daily CTs was generated. Deformation mappings computed earlier were then leveraged to map the FOV contours from the daily CT’s space to the planning CT space. After all the FOV contours were presented in the same reference space, the intersection was calculated and rendered as the common FOV contour. The intersection of individual target and OAR structures with the common FOV was subsequently calculated to ensure that daily dose volumes encompassed relevant structures.
Image Registration Validation
The image registration procedure in RayStation consists of 2 parts: rigid registration and deformable registration. To verify whether the rigid registration was performing well, we reviewed all planning CT and daily CT pairs and confirmed that the ANACONDA algorithm was performing well in all of the 74 patients’ data—ie, the bony structures were well aligned without any visible misalignment. For the deformable registration, we visually verified the resulting deformed daily CT across the dataset and confirmed that the algorithm was manifesting robustness, even when handling large but reasonable anatomical changes. Both of these reviews were performed by a senior medical physicist with extensive expertise in image guidance and registration. We note that the ANACONDA algorithm was previously validated by Weistrand et al13 on CBCT data of the head and neck regions and was reported to have performed well in comparison with other algorithms in DIR-LAB. While uncertainties inherently arise in the context of dose deformation and summation, literature quantifying the specific magnitude of the expected error associated with deformation appears lacking.
Dosimetric Evaluation
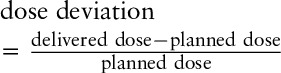
Dose that was accumulated onto the original simulation planning FBCT was used for all characterizations of the summed, delivered dose. Target coverage was evaluated in terms of dose received by 95% (D95%) and 98% (D98%) of the volume. OAR evaluations include mean dose to the parotid glands, maximum dose to the brainstem, and maximum dose to the spinal cord. Relative deviations for all metrics are reported as below:
Biological Response
With the aim of identifying cases where the parotid gland would experience a high (and subsequently increased) probability of complication due to observed increase in delivered dose, we calculated the normal tissue complication probability (NTCP) for a subset of patients that exceeded planning criteria. Specifically, we filtered out patients with parotid glands where the original planned mean dose was larger than 26 Gy (our planning goal), intersected with those patients where the difference between delivered and planned mean dose was also increased by 4 Gy or more (suggested overdose threshold for replanning by Hunter et al10), which was intended to yield insight into the biological manifestations of variations in delivered dose.
Here, we used the RayStation NTCP-Poisson LQ models15-18 for NTCP evaluation (xerostomia endpoint). For parotid glands’ NTCP metric, we set the maximum normalized gradient of the dose-response curve,
Results
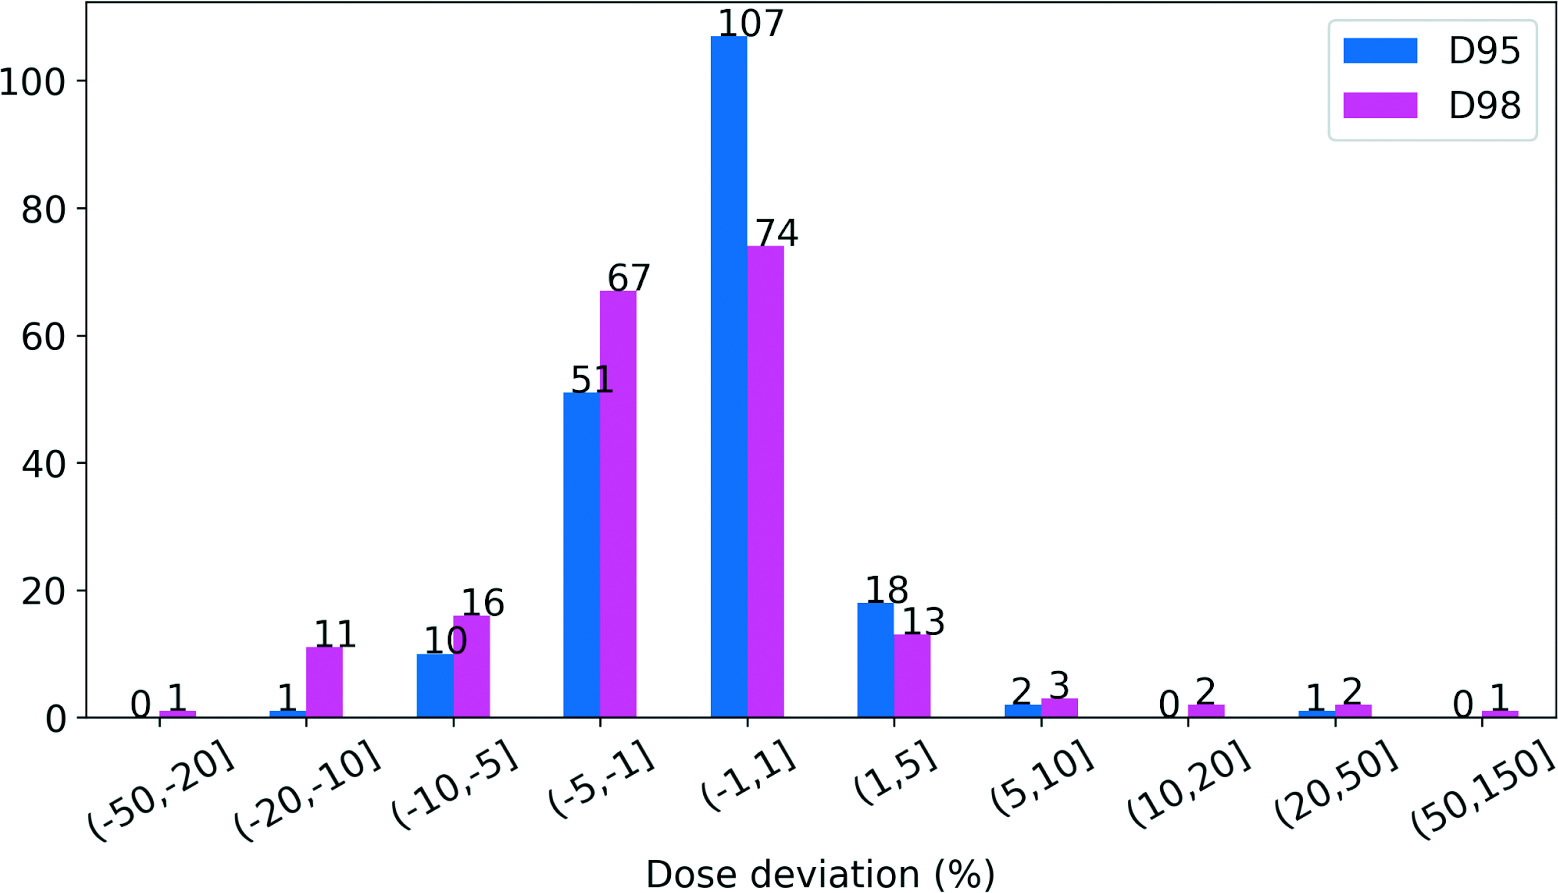
Deviations of D95/D98 for the 190 planning target volumes (PTV) are shown in
Distribution of D95 and D98 deviation in planning target volumes (PTVs). A positive percentage indicates an increase from the plan and a negative percentage depicts a decrease from the plan.
Patients with PTVs Where D95 or D98 Decreased by >10% (Bold Font)
| D95 | D98 | |||||||
|---|---|---|---|---|---|---|---|---|
| PATIENT ID | PLANNED DOSE (cGy) | DELIVERED DOSE (cGy) | ABSOLUTE DIFFERENCE | RELATIVE DIFFERENCE (%) | PLANNED DOSE (cGy) | DELIVERED DOSE (cGy) | ABSOLUTE DIFFERENCE | RELATIVE DIFFERENCE (%) |
| HN089 | 5798.7 | 5813.0 | 14.3 | 0.3 | 5653.8 | 4055.8 | −1598.1 | |
| HN021 | 5880.5 | 5663.7 | −216.8 | −3.7 | 5826.6 | 4845.7 | −980.9 | |
| HN091 | 5220.2 | 4832.6 | −387.5 | −7.4 | 3883.1 | 3234.1 | −649 | |
| HN068 | 4929.6 | 4647.9 | −281.7 | −5.7 | 4174.3 | 3549.7 | −624.7 | |
| HN104 | 6732.2 | 6719.9 | −12.3 | −0.2 | 5039.1 | 4345.2 | −693.9 | |
| HN033 | 5202.5 | 5087.9 | −114.7 | −2.2 | 5067.2 | 4452.8 | −614.4 | |
| HN010 | 5800.2 | 5458.1 | −342.1 | −5.9 | 5660.5 | 4989.7 | −670.8 | |
| HN021 | 5307.7 | 4949.7 | −358 | −6.7 | 5105.9 | 4511.2 | −594.7 | |
| HN046 | 5310.5 | 4933.0 | −377.5 | −7.1 | 5166.5 | 4565.6 | −601 | |
| HN095 | 4958.0 | 4793.3 | −164.7 | −3.3 | 4665.7 | 4123.9 | −541.8 | |
| HN057 | 5184.3 | 4771.8 | −412.5 | −8.0 | 5060.8 | 4528.8 | −532 | |
| HN068 | 6170.8 | 5940.7 | −230.1 | −3.7 | 5736.3 | 5154.7 | −581.6 | |
| HN013 | 4502.5 | 3962.2 | −540.3 | 2405.7 | 2734.4 | 328.7 | 13.7 | |
A positive percentage indicates an increase from the plan and a negative percentage depicts a decrease from the plan,
Abbreviations: PTV, planning target volume; D95, dose received by 95%; D98, dose received by 95%.
Total delivered dose was evaluated for 147 parotid glands (1 patient had only a right parotid gland), 73 brainstems (1 patient’s brainstem contour was not transferred), and 74 spinal cords. The distribution of variation between planned and delivered doses of critical OARs is detailed in
Distribution of mean dose deviation in parotid glands (A), distribution of maximum dose deviation in brainstems (B), and distribution of maximum dose deviation in spinal cords (C). A positive percentage indicates an increase from the plan and a negative percentage depicts a decrease from the plan.
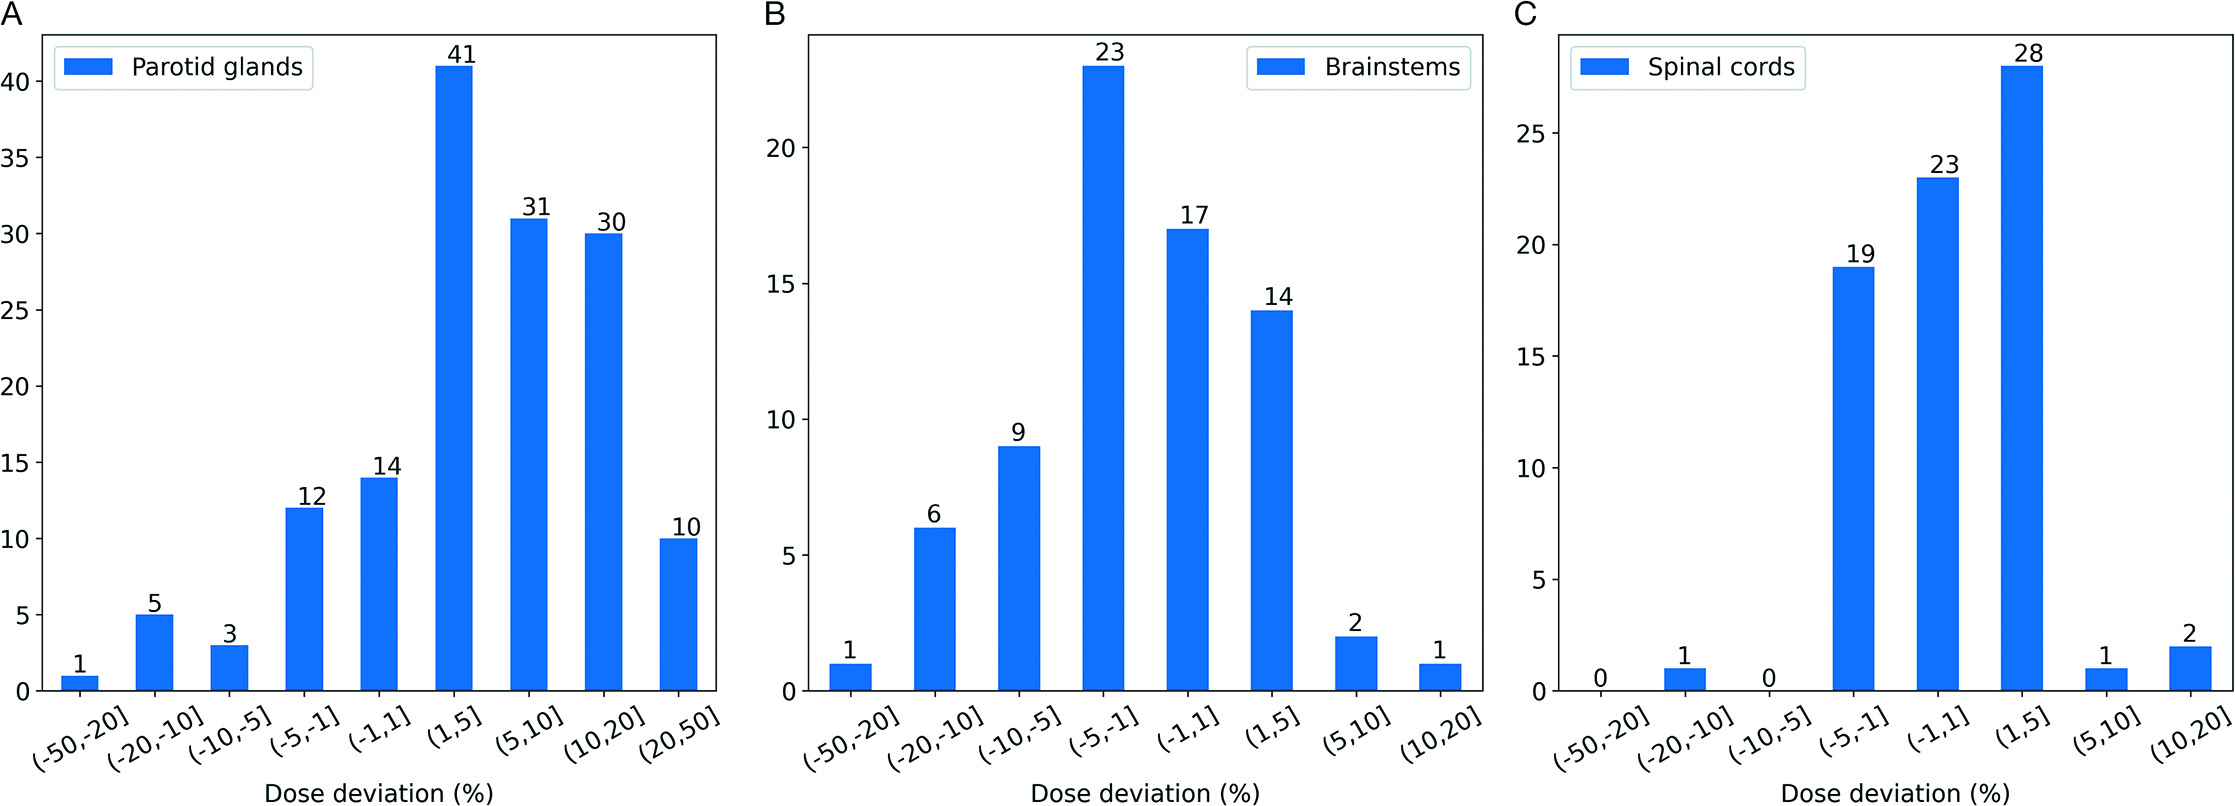
We observed an average 6.5% increase in mean dose across all 147 parotid glands for all 74 patients. Of the 147 parotid glands, 71 experienced a ≥ 5% increase in mean dose, with 10 (13.5%) receiving a 20% to 50% higher mean dose than that was indicated by the original treatment plan. Less frequent increased dosing of the brainstem was observed: the mean and maximum deviation of maximum dose was a 2.3% decrease and a 12.5% increase, respectively. Only 2 patients experienced a 5% to 10% increase in maximum dose to the brainstem, with 1 receiving a cumulated maximum dose that was 12.5% higher than that indicated by the original treatment plan. We note that while the dose to the brainstem increased above what was originally planned, it is well below the known tolerance dose for this structure. For the spinal cord, the mean and maximum deviation of maximum dose was a 0.7% increase and a 13.7% increase, respectively, with 96% of patients receiving a less than 5% relative increase above the originally planned maximum delivered dose. Again, an increase in delivered dose beyond what was originally predicted does not mean that the structure exceeded its known tolerance dose.
As demonstrated in the central and right panels of
We next curated a set of patients of interest who had at least 1 parotid gland that was prescribed a greater than 26 Gy mean, initial planning dose, and for which the subsequent delivered mean dose was even higher than the planning goal by more than 4 Gy.10 The dosimetric difference for parotid glands in this patient subset is listed in
Comparison of Mean Dose (cGy) and NTCP of Parotid Glands in Planned and Delivered Doses
| LEFT PAROTID | RIGHT PAROTID | |||||||||||
|---|---|---|---|---|---|---|---|---|---|---|---|---|
| PLANNED | DELIVERED | DIFFERENCE | PLANNED | DELIVERED | DIFFERENCE | |||||||
| PATIENT ID | DOSE | NTCP (%) | DOSE | NTCP (%) | DOSE | NTCP (%) | DOSE | NTCP (%) | DOSE | NTCP (%) | DOSE | NTCP (%) |
| HN010 | 2955.9 | 8 | 3616.3 | 31 | 657.4 | 2899.6 | 13 | 4197.8 | 57 | 1298.2 | ||
| HN011 | 3177.0 | 28 | 3638.6 | 41 | 461.6 | 2094.1 | 7 | 2514.7 | 14 | 370.7 | 7 | |
| HN022 | 1956.1 | 15 | 2236.0 | 18 | 279.9 | 3 | 3007.0 | 36 | 3514.3 | 50 | 507.3 | |
| HN023 | 2771.6 | 24 | 3410.6 | 38 | 639.0 | 2734.9 | 16 | 3261.0 | 26 | 526.1 | ||
| HN030 | 2185.1 | 5 | 2916.6 | 16 | 731.5 | 3582.9 | 25 | 4213.4 | 52 | 630.5 | ||
| HN046 | 5184.3 | 65 | 5709.3 | 82 | 525.0 | 2613.6 | 13 | 2823.6 | 32 | 210.0 | 9 | |
| HN052 | 1944.2 | 2 | 2116.7 | 3 | 172.5 | 3544.0 | 18 | 4120.9 | 32 | 576.9 | ||
| HN060 | 4652.3 | 62 | 5378.2 | 79 | 725.9 | 826.8 | 0 | 867.5 | 0 | 40.8 | 0 | |
| HN090 | 3211.7 | 21 | 3267.7 | 24 | 55.9 | 3 | 3678.0 | 31 | 4096.8 | 47 | 418.9 | |
| HN129 | 4735.3 | 64 | 5207.6 | 75 | 472.3 | 4004.7 | 32 | 4612.6 | 39 | 607.9 | 7 | |
Bold font suggests a more than 10% NTCP increase. A positive percentage indicates an increase from the plan and a negative percentage depicts a decrease from the plan.
Abbreviation: NTCP, normal tissue complication probability.
Of 74 patients, 10 experienced a nontrivial variation of the delivered dose in parotid glands (according to the previously stated criteria), which resulted in NTCP increases compared with the anticipated NTCP in the original plan, ranging from 11% to 44%.
Discussion
In this study, we used in-room, CTOR-generated FBCT datasets, equivalent to the high-fidelity fan-beam simulation CT datasets used for the original plan calculation to recalculate daily variations to the dose actually delivered to 74 patients with HNC during more than 2200 treatment fractions, using an average of 19 daily imaging sessions per patient. When daily images were not available for dose calculation, the most recent CT image set and dose calculation were used, with the intent of characterizing dose delivery integrity for each day on which treatment was delivered. While an average of 19 daily FBCT image sets were acquired per patient, with 14 out of 74 patients having daily FBCTs corresponding to each fraction, 24 patients having an average of 1-2 treatment fractions per validation FBCT, and 36 patients having an average treatment fraction per FBCT greater than 2, we acknowledge this approach as a limitation relative to having verification FBCTs acquired every day for all patients. The use of high-quality fan-beam datasets from in-room CTOR for all daily imaging sessions ensures that the daily dose variations we characterized are equivalent in fidelity to the original, planned dose distributions, overcoming the limitations of other approaches that used less accurate CBCT-generated dose recalculations. Whether by physician directive or due to machine downtime, a minority of patients included in this cohort had images for every day of treatment. Multiple approaches exist to estimate dose metrics at time points that do not have corresponding image data, including averaging metrics over time, using the CT from the date closest to the date missing an image, or using deformation to generate synthetic images of the day, to name but a few. Each approach endeavors to estimate the state of relevant anatomy on days for which the dose was delivered, but imaging was not available, and each approach entails the potential for introduction of uncertainties in the final calculation. Changes in daily imaging can be random or systematic and can occur acutely or progressively over time. In the absence of daily imaging, precise dynamics are ultimately unknown and it remains unclear as to which approach may be best for a particular scenario. In this work, we chose to use the FBCT dataset from the most recently acquired date as the representative daily image since this method has been previously employed.19 We acknowledge that anything short of daily imaging for all patients represents a limitation of this study.
The presented data confirm that the vast majority of patients treated using high-quality daily image guidance receives delivered dose distributions that are very consistent with the originally planned treatment. However, nontrivial variations in delivered dose were still observed for multiple patients. Nontrivial increases to the parotid gland demonstrate that even when rigorous, high-quality image guidance is performed, clinically concerning variations to predicted dose delivery can occur.
With regard to dose variation, significantly more patients experienced increases in delivered dose (vs decreased dose) of the parotid gland, which is reasonable when we consider that typical planning isodose distributions achieve full coverage of the immediately adjacent target area by carefully carving out a narrow window of sparing for the parotid gland. Any variation or change in patient body habitus (eg, weight loss) can easily cause the previously protected parotid gland to shift into the high-dose region, and thus be overdosed.
While significant increases in the delivered dose, relative to the planned dose, are of obvious potential concern, the most important factor to consider is the biological impact. We curated 10 patients (13.5%) as patients of interest to better characterize biological impact, for which we subsequently calculated the NTCP for a xerostomia endpoint. Remarkably, 2 of the 10 patients of interest experienced more than a 25% increase in the original probability of xerostomia (27% and 44%, respectively), which characterizes the clinically significant increase in risk to the patient vs simple quantification of delivered dose variation.
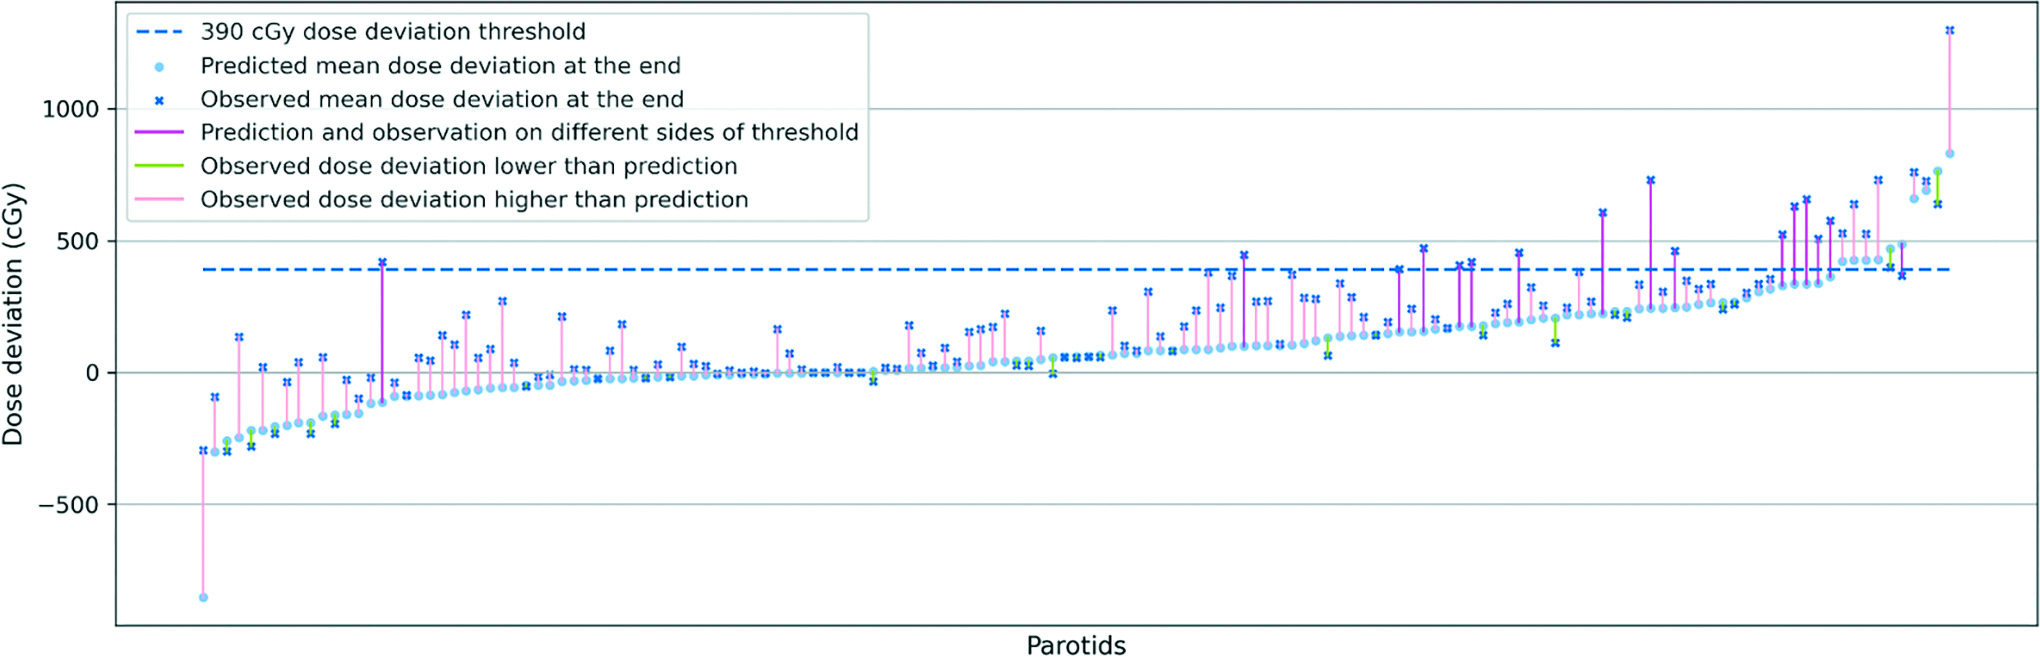
To evaluate the potential need to replan during the treatment course, we also explored the correlation between the dosimetric data at the middle and the end of the treatment, as previously proposed by Hunter et al10 and McCulloch et al11 where it was suggested that a midcourse dose deviation is likely to be predictive of the outcome for the entire treatment course. Recently published data from McCulloch et al11 suggested that a less than 15% deviation between planned and delivered doses for parotid glands would not have a significant toxicity impact on a patient population. While this threshold may be debatable, we endeavored to investigate the validity of this assertion for our own dataset. In
Correlation between predicted mean dose deviation and observed total mean dose deviation. Parotid glands are sorted ascendingly from left to right by predicted mean dose deviation at the end of the treatment (light blue points). The corresponding observed total mean dose deviations (dark blue crossmark) are connected by color-coded segments to predicted mean dose. For the parotids that saw decreases from predicted deviation to observed deviation, we use light green to color the segments. For the parotids that saw increases from predicted deviation to observed deviation, but prediction and observation are on the same side of the threshold (dashed line), we use light pink to color the segment. For the parotids that saw increases from predicted deviation to observed deviation, where prediction and observation are on the different sides of the dashed line, we use dark pink to color the segment to underscore the significance of the subject.
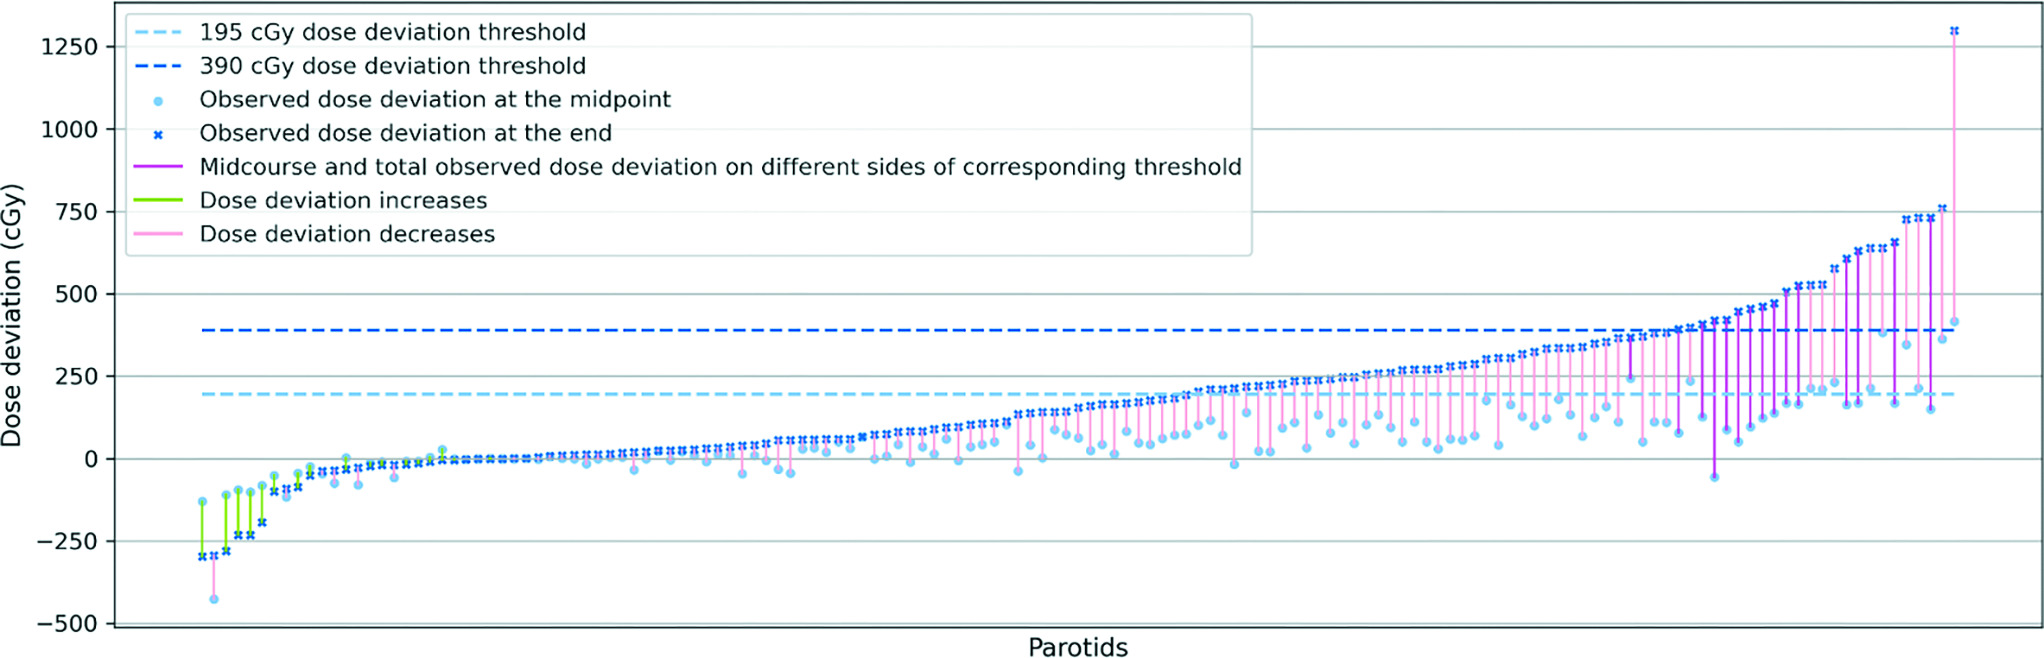
To ascertain a proper threshold for predicting the need for replanning, we reorganized the parotid gland data in
Correlation between observed mean dose deviation at midpoint of the treatment and at the end of the treatment. Parotid glands are sorted ascendingly from left to right by observed mean dose deviation at the end of the treatment (dark blue crossmark). The corresponding midcourse mean dose deviations (light blue points) are connected by color-coded segments to total mean dose deviation. For the parotids that saw decreases from midcourse to total observed mean dose deviation, we use light green to color the segments. For the parotids that saw increases from midcourse to total observed mean dose deviation, but the 2 are on the same side of the corresponding threshold (light blue dashed line corresponds to light blue dots, dark blue dashed line corresponds to dark blue crossmarks), we use light pink to color the segment. For the parotids for which the midcourse and total observed mean dose deviation are on the different sides of the corresponding dashed line, we use dark pink to color the segment to underscore the significance of the subject. In spite of the upward trend of the dark blue crossmarks representing different parotid glands’ observed total mean dose deviation, we could not observe an upward trend in midcourse dose deviation (light blue points), regardless of the variance of the midcourse deviation increases with the trend of total dose deviation.
In the interest of identifying a specific threshold model to identify patients in need of replanning, we also investigated the correlation between predicted and actual total dose deviation. In
2D distribution of parotid glands in the space of final actual dose deviation—final predicted dose deviation at the end. Points are color-coded by the residual to the ideal linear model (A). Bland-Altman plot of actual dose deviation and predicted dose deviation in parotid glands. Points are color-coded by the difference between the actual dose deviation and the predicted dose deviation.
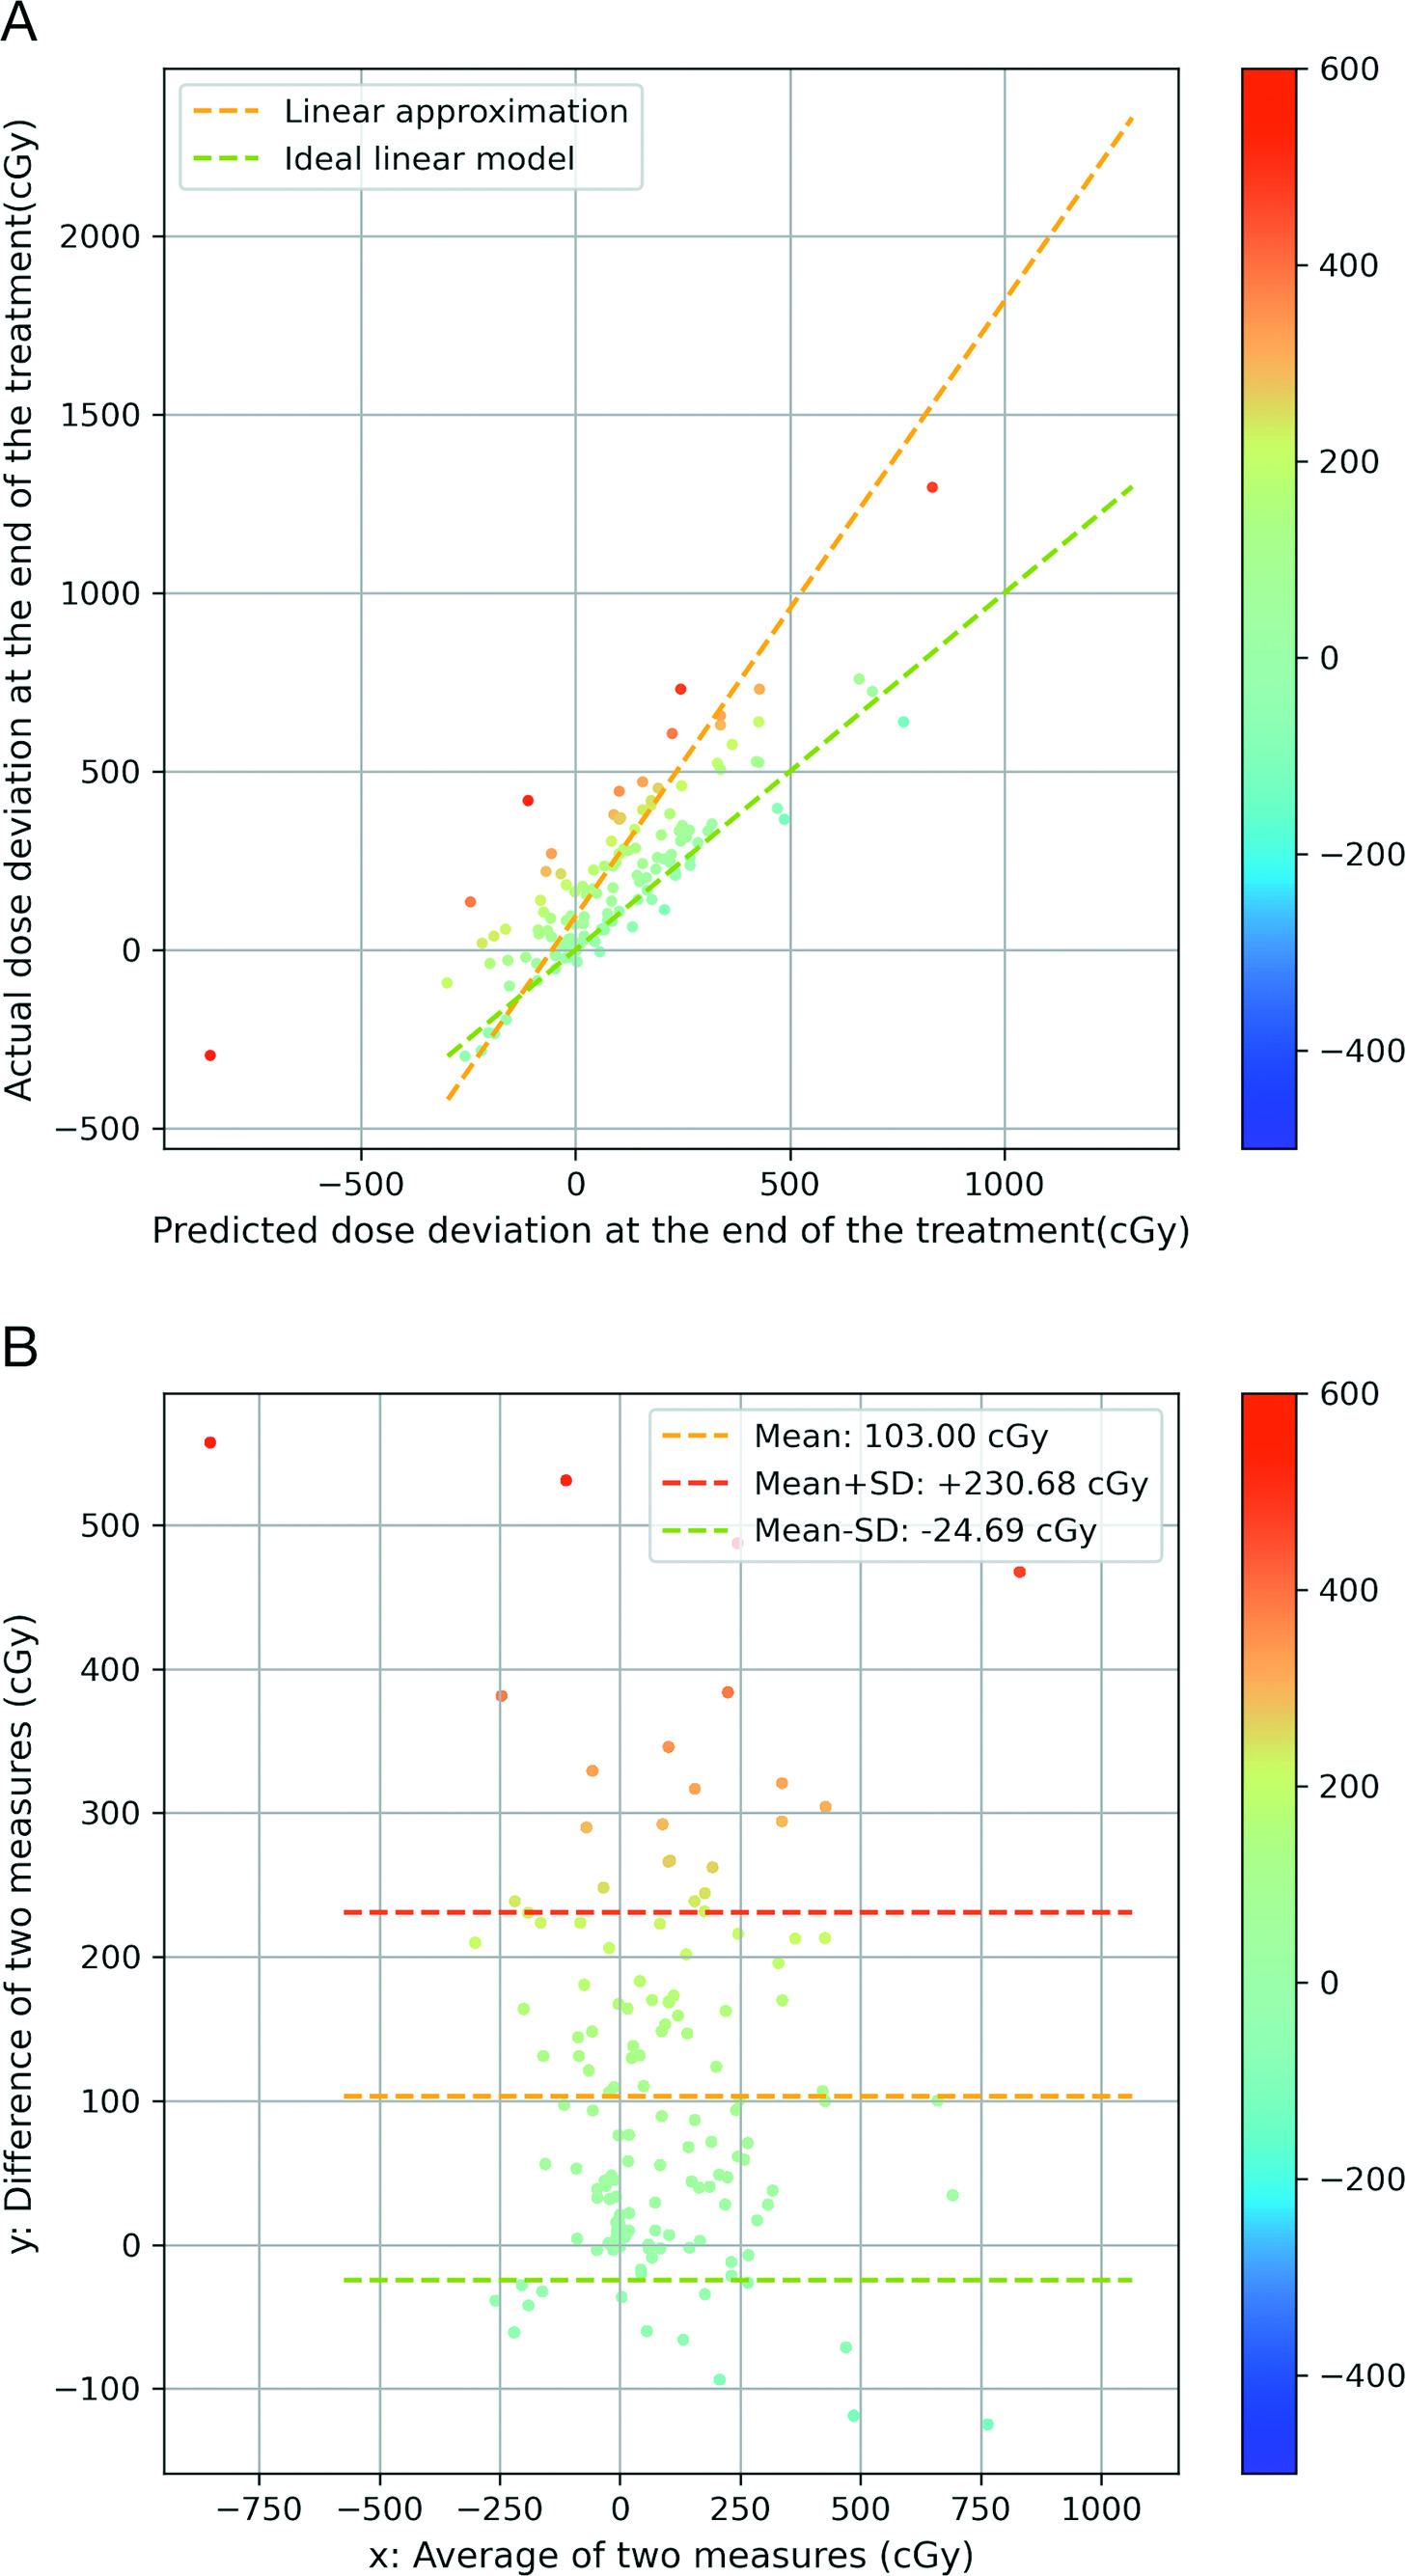
The more red the data points are, the larger the positive dose difference that exists. The more blue the data points are, the larger the negative dose difference that exists. We leveraged a linear regression model to represent the correlation of the 2 variables and visualized it as the yellow dashed line. To yield a more intuitive illustration, we also plotted a green dashed line with slope = 1 and
In
The high-fidelity CTOR-derived, delivered dose data presented here make clear that a limited subset of patients may experience clinically relevant increases in delivered dose, even when these patients are treated with daily, high-resolution image guidance. Our data further confirm that, through the use of high-quality FBCT-based dose recalculation, some degree of adaptive replanning will be needed for a subset of patients and, furthermore, a midcourse evaluation of dose deviation is not necessarily effective in predicting the need for replanning for all patient populations.
Conclusions
Our use of gold standard FBCT image data allowed for characterization of the total delivered dose for each of the 74 patients with HNC studied here with accuracy comparable to the original simulation-based dose calculation and, thereby, eliminated the uncertainties of previous CBCT-based studies. The accumulated total delivered dose distributions agreed well for the vast majority of patients in this dataset. However, clinically notable deviations were observed for the summed delivered dose to the parotid glands of 10 patients, leading to NTCP increases of 11% to 44%. We further determined that a midcourse evaluation of dose deviation was not effective in predicting the need for replanning for our patient cohort.
The high-fidelity FBCT-based dose data presented here should be extremely useful for exploring novel strategies to most effectively predict the need for and timing of replanning efforts, a topic of future work for our group.
Therefore, it is important to appreciate how inherent and unavoidable setup discrepancies, combined with anatomical changes over time, can manifest as nontrivial deviations of the intended delivered dose. These nontrivial increases to parotid gland delivered dose suggest that even when rigorous, high-quality image guidance is performed, clinically concerning variations to predicted dose delivery can still occur.
References
- Chao KS, Majhail N, Huang CJ Intensity-modulated radiation therapy reduces late salivary toxicity without compromising tumor control in patients with oropharyngeal carcinoma: a comparison with conventional techniques. Radiother Oncol. 2001; 3(61):275-280
- Lee N, Xia P, Quivey JM Intensity-modulated radiotherapy in the treatment of nasopharyngeal carcinoma: an update of the UCSF experience. Int J Radiat Oncol Biol Phys. 2002; 1(53):12-22
- Eisbruch A, Harris J, Garden AS Multi-institutional trial of accelerated hypofractionated intensity-modulated radiation therapy for early-stage oropharyngeal cancer (RTOG 00-22). Int J Radiat Oncol Biol Phys. 2010; 5(76):1333-1338
- Barnett GC, West CML, Dunning AM Normal tissue reactions to radiotherapy: towards tailoring treatment dose by genotype. Nat Rev Cancer. 2009; 2(9):134-142
- O’Daniel JC, Garden AS, Schwartz DL Parotid gland dose in intensity-modulated radiotherapy for head and neck cancer: Is what you plan what you get?. Int J Radiat Oncol Biol Phys. 2007; 4(69):1290-1296
- Giacometti V, King RB, Agnew CE An evaluation of techniques for dose calculation on cone beam computed tomography. Br J Radiol. 2019; 1096(92):undefined-undefined
- Lee C, Langen KM, Lu W Assessment of parotid gland dose changes during head and neck cancer radiotherapy using daily megavoltage computed tomography and deformable image registration. Int J Radiat Oncol Biol Phys. 2008; 5(71):1563-1571
- Barker JL, Garden AS, Ang KK Quantification of volumetric and geometric changes occurring during fractionated radiotherapy for head-and-neck cancer using an integrated CT/linear accelerator system. Int J Radiat Oncol Biol Phys. 2004; 4(59):960-970
- Beltran M, Ramos M, Rovira JJ Dose variations in tumor volumes and organs at risk during IMRT for head-and-neck cancer. J Appl Clin Med Phys. 2012; 6(13):3723-undefined
- Hunter KU, Fernandes LL, Vineberg KA Parotid glands dose-effect relationships based on their actually delivered doses: implications for adaptive replanning in radiation therapy of head-and-neck cancer. Int J Radiat Oncol Biol Phys. 2013; 4(87):676-682
- McCulloch MM, Lee C, Rosen BS Predictive models to determine clinically relevant deviations in delivered dose for head and neck cancer. Pract Radiat Oncol. 2019; 4(9):e422-e431
- Bodensteiner D Raystation: external beam treatment planning system. Med Dosim. 2018; 2(43):168-176
- Weistrand O, Svensson S The anaconda algorithm for deformable image registration in radiotherapy. Med Phys. 2015; 1(42):40-53
- Ahnesjö A Collapsed cone convolution of radiant energy for photon dose calculation in heterogeneous media. Med Phys. 1989; 4(16):577-592
- Källman P, Agren A, Brahme A Tumour and normal tissue responses to fractionated non-uniform dose delivery. Int J Radiat Biol. 1992; 2(62):249-262
- Brahme A Dosimetric precision requirements in radiation therapy. Acta Radiol Oncol. 1984; 5(23):379-391
- Levin-Plotnik D, Hamilton RJ, Niemierko A A model for optimizing normal tissue complication probability in the spinal cord using a generalized incomplete repair scheme. Radiat Res. 2001; 4(155):593-602
- Lind BK, Mavroidis P, Hyödynmaa S Optimization of the dose level for a given treatment plan to maximize the complication-free tumor cure. Acta Oncol. 1999; 6(38):787-798
- Thongsuk W, Nobnop W, Chitapanarux I Evaluation of daily dose accumulation with deformable image registration method using helical tomotherapy images for nasopharyngeal carcinoma. J Radiother Pract. 2021; 3(20):273-278
Citation
Dai H, Sarkar V, Dial C, Foote MD, Hitchcock Y, Joshi S, Salter BJ. High-Fidelity CT-on-Rails-Based Characterization of Delivered Dose Variation in Conformal Head and Neck Treatments. Appl Rad Oncol. 2023;(4):29-39.
doi:10.37549/ARO-D-23-00013
December 1, 2023